Fig. 3
Download original image
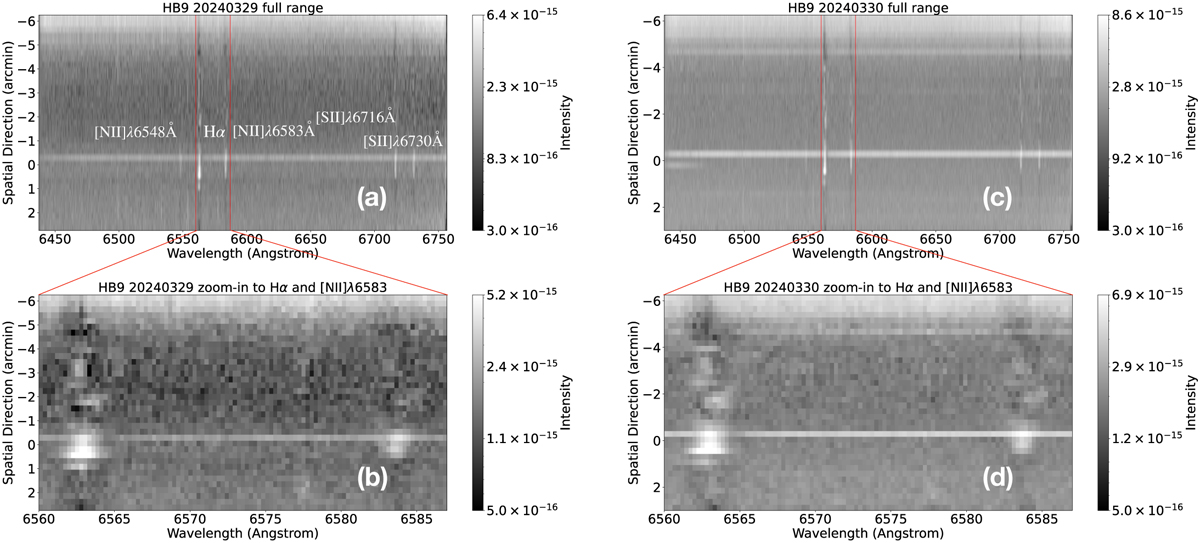
2D spectra of the SE shell of HB9 extracted from the slit shown in Fig. 1. The left and right panels show the spectra taken on March 29 and March 30 2024, respectively. The y axis is the distance in arcmin from the bright star used for slit acquisition (appearing as a bright horizontal line), while the x axis is the wavelength in Å. The colour bar shows the intensity in units of ergs s–1cm–2 Å–1. Prominent emission lines are denoted. The vertical red lines in the upper panels show the wavelength range of the Hα and [N II] λ6583 Å lines, which is further zoomed in on in the lower panels.
Current usage metrics show cumulative count of Article Views (full-text article views including HTML views, PDF and ePub downloads, according to the available data) and Abstracts Views on Vision4Press platform.
Data correspond to usage on the plateform after 2015. The current usage metrics is available 48-96 hours after online publication and is updated daily on week days.
Initial download of the metrics may take a while.