Fig. 2
Download original image
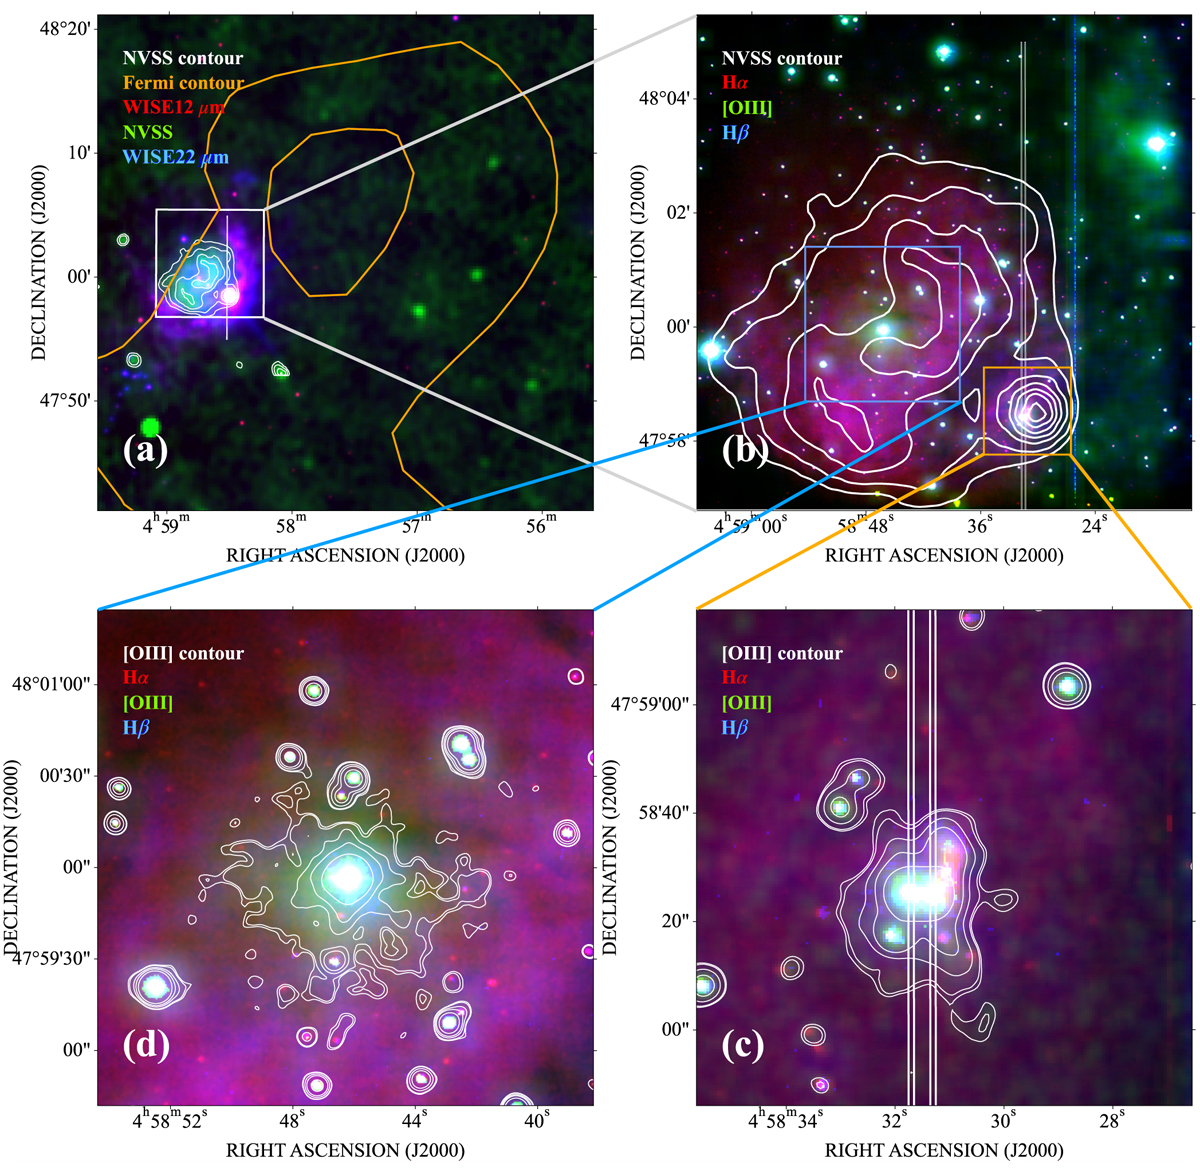
Multi-wavelength images of the H II region G159.2+3.3. (a) NVSS 1.4 GHz (green and white contours) and WISE 12 µm (red)/22 µm (blue) images. The orange contours are the Fermi -LAT image presented in Fig. 1a. The 8.7′ × 8.7′ white box is the FoV of our MDM 1.3m optical images presented in panel b, while the vertical bar marks the approximate location of the CCDS slit. (b) Smoothed MDM 1.3m narrow-band images: Hα (red), [O III] λ5007 Å (green), Hβ (blue). The contours show the same NVSS image as in panel a. The two vertical lines are the locations of the slits used in the two CCDS spectroscopy observations, falling on two close (separated by ≈3.5″) bright stars, respectively. The smaller orange (1.52′× 1.52′) and bigger blue (2.71′ × 2.71′) boxes are the FoVs of panels c and d, which show two areas with possibly extended [OIII] emission (highlighted with white contours in these two panels).
Current usage metrics show cumulative count of Article Views (full-text article views including HTML views, PDF and ePub downloads, according to the available data) and Abstracts Views on Vision4Press platform.
Data correspond to usage on the plateform after 2015. The current usage metrics is available 48-96 hours after online publication and is updated daily on week days.
Initial download of the metrics may take a while.