Fig. 1
Download original image
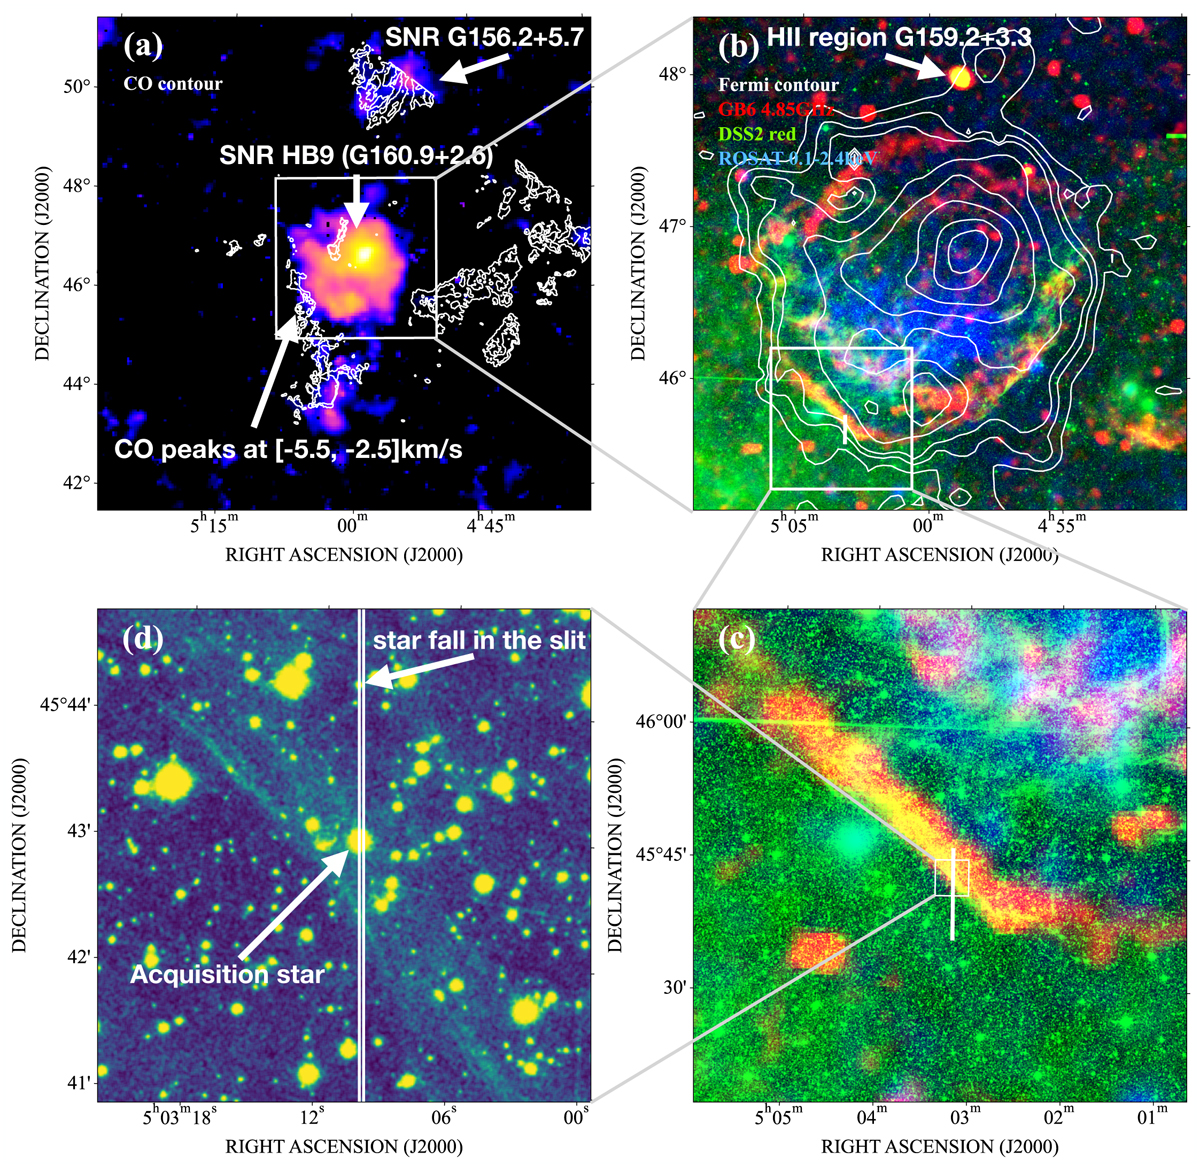
Multi-wavelength images of the SNR HB9, the H II region G159.2+3.3, and the surrounding area. (a) False colour Fermi-LAT 1–300 GeV TS map centred on the SNR HB9. The white contours are the PMO 13.7 m 12CO (J=1–0) image from the MWISP–CO line survey, integrated in the velocity range of –13.0 – +6.5 km s–1. The γ-ray and CO enhancement in the upper part of the image is apparently associated with another SNR, G156.2+5.7. The 3.25° × 3.25° white box in the centre is the FoV of the images shown in panel b. (b) The red colour is the 4.85 GHz radio continuum image from the Green Bank 6-cm (GB6) survey (Gregory et al. 1996). The green colour is the DSS2 red-band image that covers the Hα line. The blue colour is the ROSAT/PSPC broad-band (0.1–2.4 keV) image obtained from the ROSAT All Sky Survey (RASS; Voges et al. 1999). The contours outline the Fermi-LAT image in panel a. The 0.93° × 0.93° white box in the lower left is the FoV of panel c, with the vertical bar overlaid on the bright SE filament marking the location of the MDM 1.3 m/CCDS slit. (c) Zoom-in of panel b, with the slit location plotted as a white bar, which is the same as the white bar in panel b. The 3.92° × 3.92° black box is the FoV of panel d. (d) Zoom-in PanSTARRS r-band image close to the centre of the slit. The double lines illustrate the width of the slit.
Current usage metrics show cumulative count of Article Views (full-text article views including HTML views, PDF and ePub downloads, according to the available data) and Abstracts Views on Vision4Press platform.
Data correspond to usage on the plateform after 2015. The current usage metrics is available 48-96 hours after online publication and is updated daily on week days.
Initial download of the metrics may take a while.