Fig. 2
Download original image
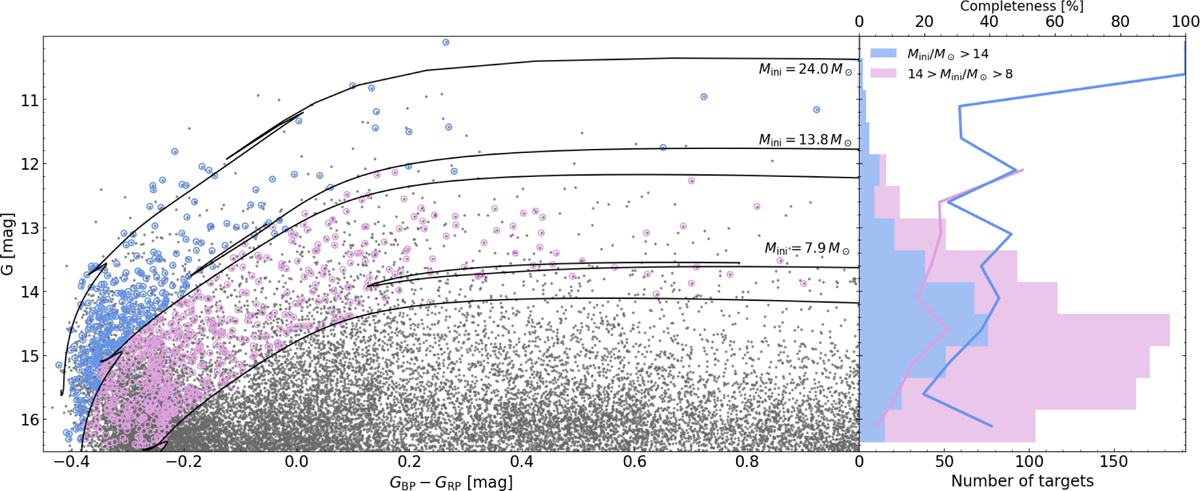
Completeness of the BLOeM dataset with respect to the underlying Gaia catalogue. Left: CMD showing the underlying Gaia catalogue used to choose the BLOeM sample (black dots). Three evolution tracks computed by Schootemeijer et al. (2019) and Hastings et al. (2021) with the MESA stellar evolution code (see Sec. 5.4) for Mini = 7.9, 13.8, and 24 M⊙ are plotted. The tracks were adjusted to the SMC distance and an average reddening and extinction (see text for details). BLOeM targets are encircled with blue (Mini/M⊙ ≳ 14; born as O-type stars) and pink (8 ≲ Mini/M⊙ ≲ 14; born as B-type stars) circles. Right: Magnitude distribution of the subsamples, along with completeness fractions for the two subsamples with respect to the underlying Gaia SMC catalogue.
Current usage metrics show cumulative count of Article Views (full-text article views including HTML views, PDF and ePub downloads, according to the available data) and Abstracts Views on Vision4Press platform.
Data correspond to usage on the plateform after 2015. The current usage metrics is available 48-96 hours after online publication and is updated daily on week days.
Initial download of the metrics may take a while.