Fig. 1.
Download original image
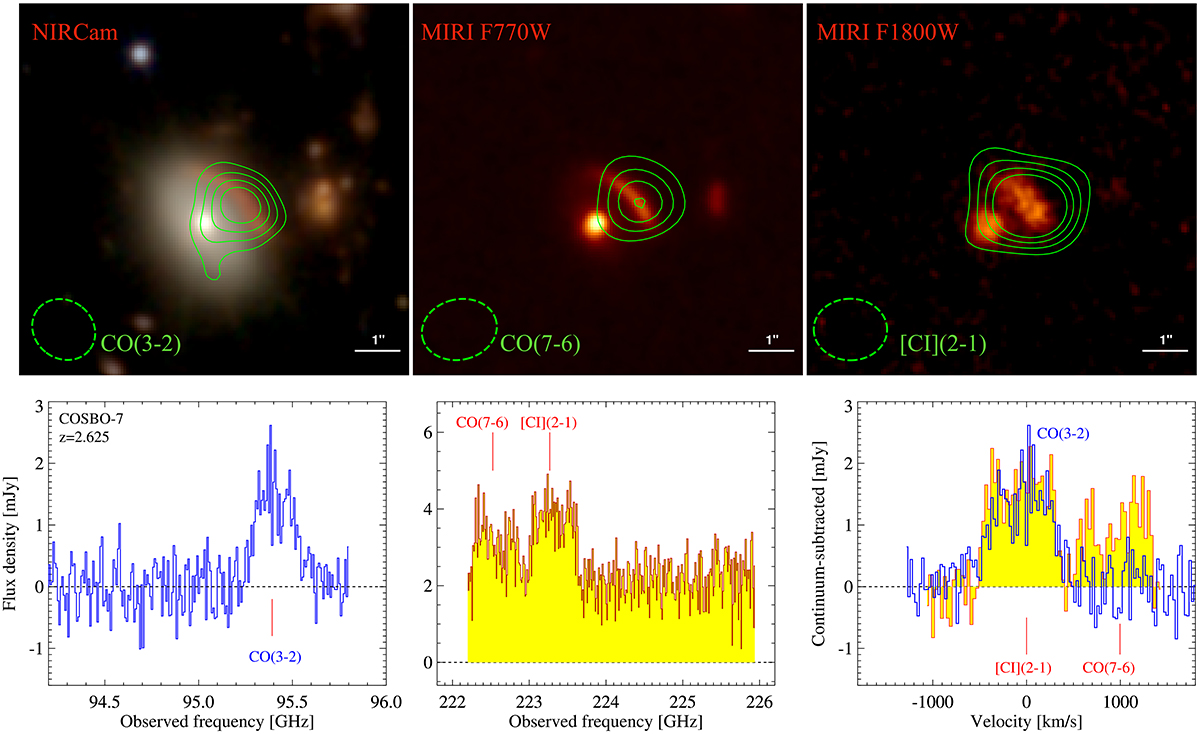
JWST images and ALMA spectra of COSBO-7. Top: NIRCam color image (Blue: F090W+F115W+F150W; Green: F200W+F277W; Red: F356W+F410M+F444W), and MIRI images overlaid with contours of CO and [CI] emission. Contours are shown at 4, 6, 8, and 10σ levels. The beams are shown as dashed ellipses. Bottom: Left and middle panels show the CO(3–2) and CO(7–6)+[CI](2–1) spectra in observed frequencies. The right panel shows the continuum-subtracted spectra as a function of velocity.
Current usage metrics show cumulative count of Article Views (full-text article views including HTML views, PDF and ePub downloads, according to the available data) and Abstracts Views on Vision4Press platform.
Data correspond to usage on the plateform after 2015. The current usage metrics is available 48-96 hours after online publication and is updated daily on week days.
Initial download of the metrics may take a while.