Fig. 5.
Download original image
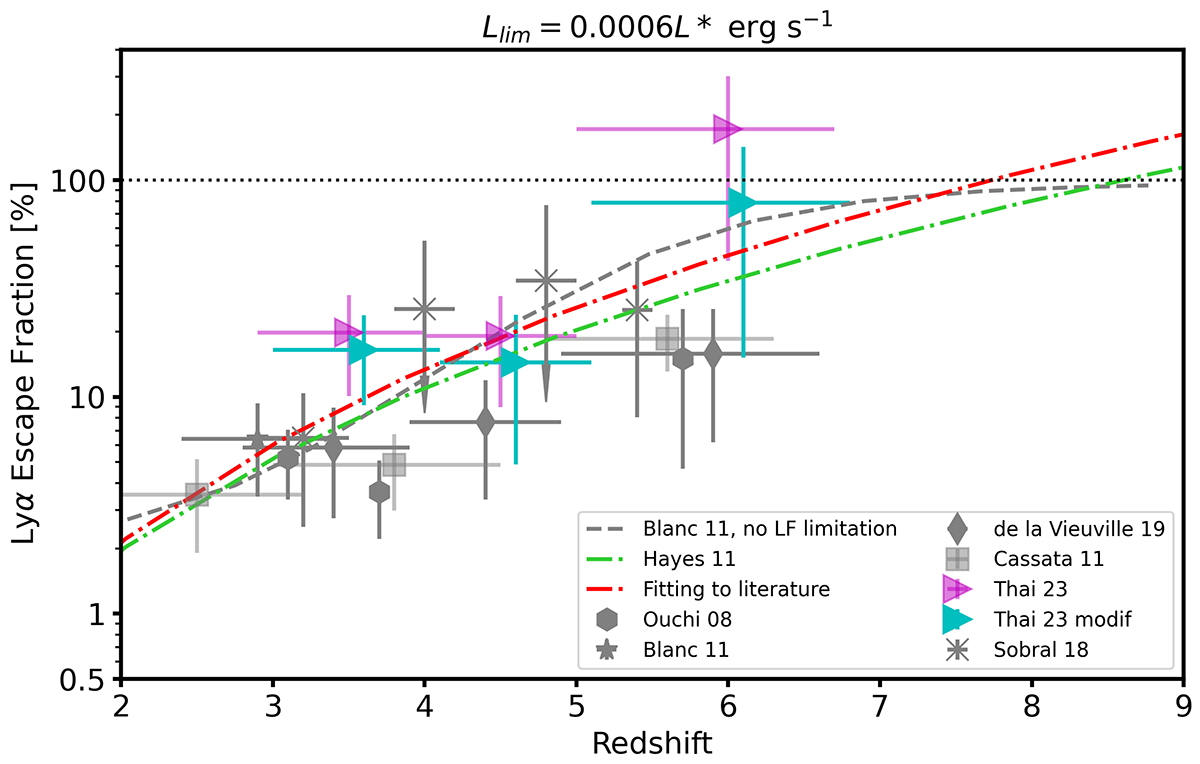
Global redshift evolution of fesc, Lyα with an integration limit on both LFs of 0.0006L*. Results from this study are shown by cyan (modified Schechter function) and pink (general Schechter function) points. Power-law fits from the literature are shown in grey and green (B11, Hayes et al. 2011) and the equivalent fit to all the data is shown in red. The fit from Hayes et al. (2011) is derived from results integrated to 0.04L*, and the fit from B11 from results integrated to 0.
Current usage metrics show cumulative count of Article Views (full-text article views including HTML views, PDF and ePub downloads, according to the available data) and Abstracts Views on Vision4Press platform.
Data correspond to usage on the plateform after 2015. The current usage metrics is available 48-96 hours after online publication and is updated daily on week days.
Initial download of the metrics may take a while.