Fig. 3.
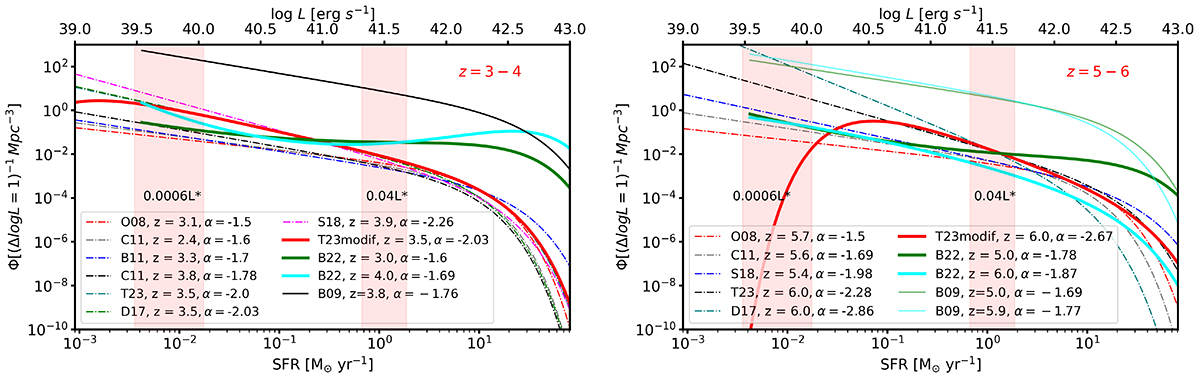
Download original image
Ultraviolet and LAE LFs included in our analysis on a common x-axis of SFR. The LFs of Bouwens et al. (2022) and Thai et al. (2023) are shown in bold and the literature LFs are shown in coloured dash-dotted lines. The LF integration limits in terms of L* that we use throughout this work are denoted by the pink shaded regions. Left: Results from the redshift range 3 to 4. Right: Results from the redshift range 5 to 6. The literature LFs in the graph are shown in shorthand in the caption and here in full, in order: Ouchi et al. (2008), Cassata et al. (2011), Sobral et al. (2018), Thai et al. (2023), Drake et al. (2017), Bouwens et al. (2022, 2009).
Current usage metrics show cumulative count of Article Views (full-text article views including HTML views, PDF and ePub downloads, according to the available data) and Abstracts Views on Vision4Press platform.
Data correspond to usage on the plateform after 2015. The current usage metrics is available 48-96 hours after online publication and is updated daily on week days.
Initial download of the metrics may take a while.