Open Access
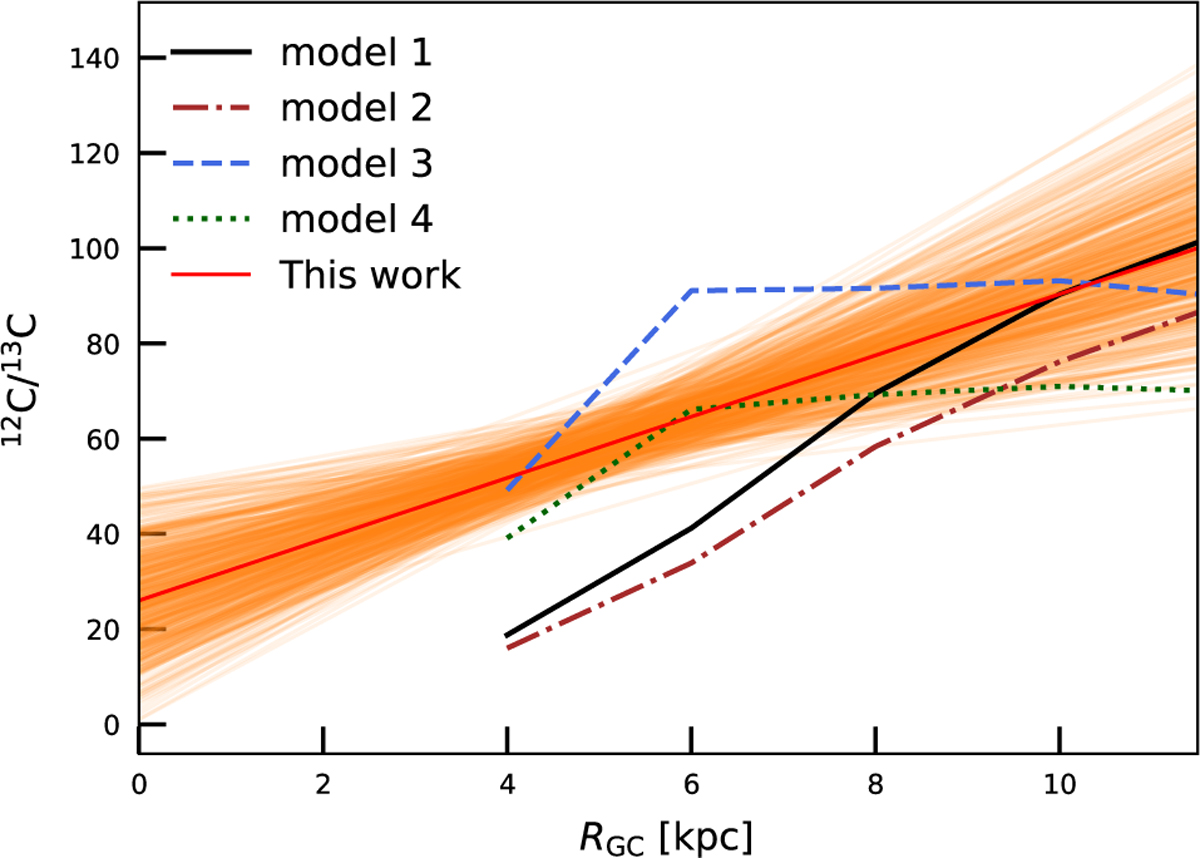
Fig. 4
Download original image
Comparison between observations and GCE models, in which the models are taken from Table 2 in Colzi et al. (2022) with the same numbers.
Current usage metrics show cumulative count of Article Views (full-text article views including HTML views, PDF and ePub downloads, according to the available data) and Abstracts Views on Vision4Press platform.
Data correspond to usage on the plateform after 2015. The current usage metrics is available 48-96 hours after online publication and is updated daily on week days.
Initial download of the metrics may take a while.