Fig. 3
Download original image
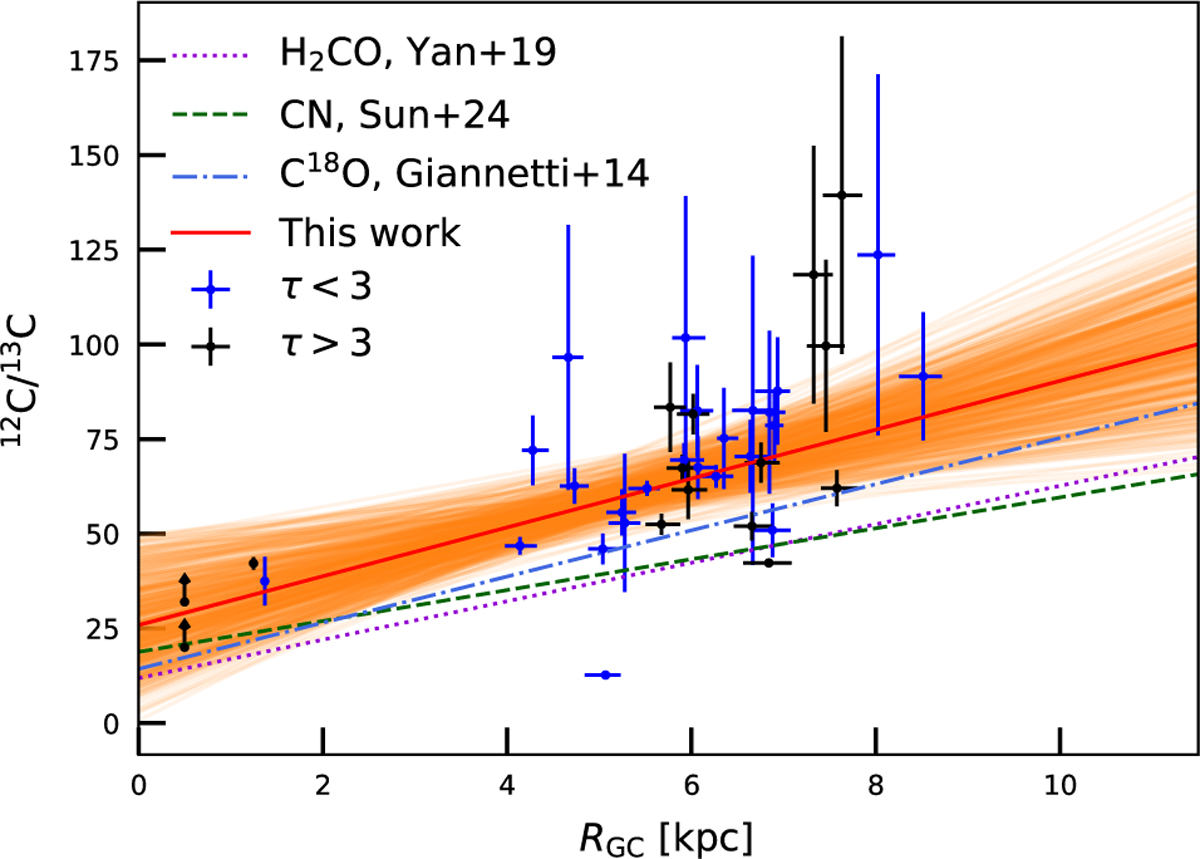
Measurements of H12CO+/H13CO+ as a function of RGC and comparison of the derived gradients between different works. Blue dots represent τHCO+ < 3, and black dots represent τHCO+ > 3. The two lower limits are shifted to RGC = 0.5 kpc for better visualization. The red curve denotes the maximum likelihood fit of the blue points only; orange curves denote the 3σ deviation from the MCMC sampling.
Current usage metrics show cumulative count of Article Views (full-text article views including HTML views, PDF and ePub downloads, according to the available data) and Abstracts Views on Vision4Press platform.
Data correspond to usage on the plateform after 2015. The current usage metrics is available 48-96 hours after online publication and is updated daily on week days.
Initial download of the metrics may take a while.