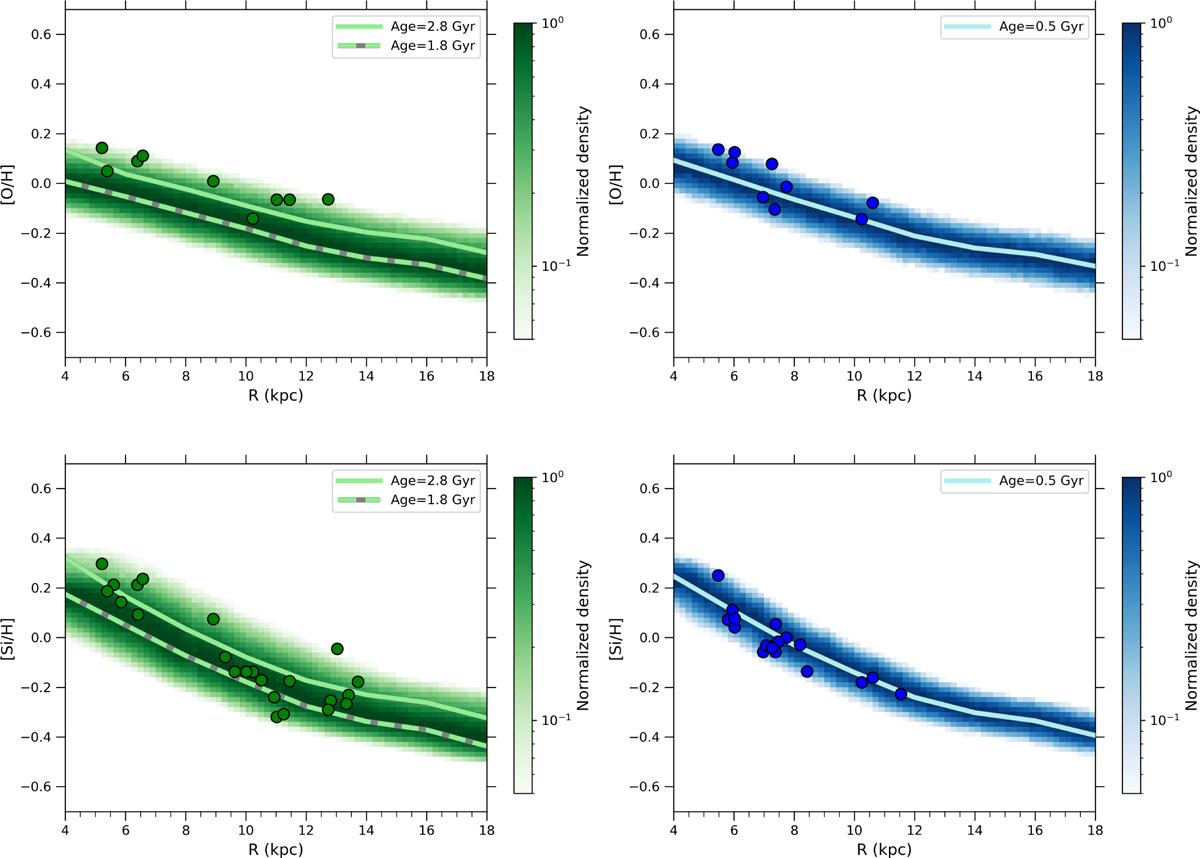
Fig. 9
Download original image
Radial and [O/H] (upper panels) and [Si/H] (lower panels) gradients at 1 < Age/Gyr < 3 (left panels) and Age < 1 Gyr (right panels) for the model 3INF-2, including stellar migration and average OC spread (see Section 3.4). Lines show the results for the [Fe/H] gradient as predicted by the model at Ages=0.5 Gyr (cyan lines), 1.8 Gyr (green dashed lines), and 2.8 Gyr (green solid lines). Filled circles represent the restricted sample within OCs in Magrini et al. (2023).
Current usage metrics show cumulative count of Article Views (full-text article views including HTML views, PDF and ePub downloads, according to the available data) and Abstracts Views on Vision4Press platform.
Data correspond to usage on the plateform after 2015. The current usage metrics is available 48-96 hours after online publication and is updated daily on week days.
Initial download of the metrics may take a while.