Fig. 2
Download original image
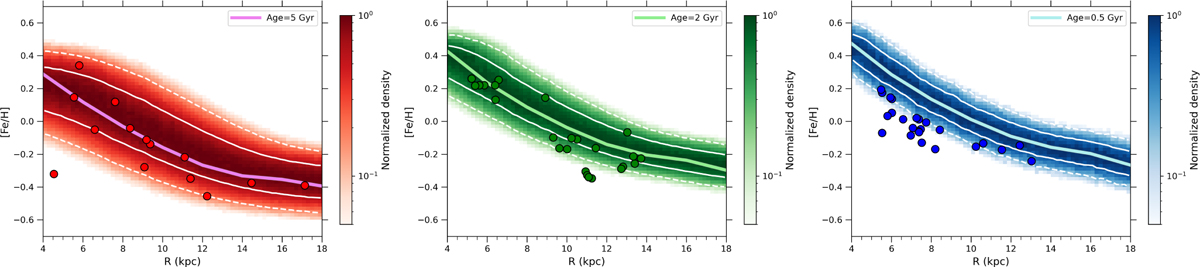
Time evolution of the radial [Fe/H] gradient as predicted by the two-infall model at Age > 3 Gyr (left panel), 1 < Age/Gyr < 3 (central panel), and Age < 1 Gyr (right panel) for the two-infall model, including stellar migration and abundance uncertainties (see Sect. 3.4). Density plots show the normalised density (in log scale) of stars as predicted by the model in given Galactocentric bin of 0.2 kpc width. White contour lines show the limits within are contained the 68% (solid) and the 95% (dashed) of the predicted stellar distribution in a given radial bin. Solid lines show the results for the [Fe/H] gradient as predicted by the genuine chemical tracks, i.e. the ones shown in Fig. 1, at Ages=0.5 Gyr (cyan line), 2 Gyr (green line) and 5 Gyr (magenta line). Data are the same as in Fig. 1
Current usage metrics show cumulative count of Article Views (full-text article views including HTML views, PDF and ePub downloads, according to the available data) and Abstracts Views on Vision4Press platform.
Data correspond to usage on the plateform after 2015. The current usage metrics is available 48-96 hours after online publication and is updated daily on week days.
Initial download of the metrics may take a while.