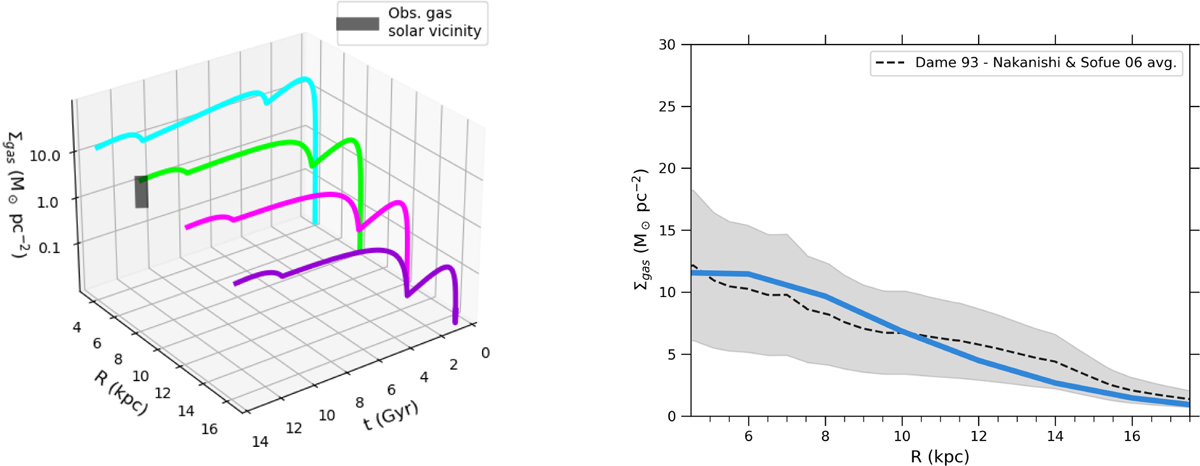
Fig. B.2
Download original image
Left panel: gas surface density time evolution at 4, 8, 12, and 16 kpc. The present-day observed value for the solar vicinity is taken from Dame (1993); Nakanishi & Sofue (2003, 2006). Right panel: present-day radial gas surface density gradient. The dashed curve is the average between the Dame (1993) and Nakanishi & Sofue (2003, 2006) data sets. The grey shaded region represents the typical uncertainty at each radius (see Palla et al. 2020b for more details).
Current usage metrics show cumulative count of Article Views (full-text article views including HTML views, PDF and ePub downloads, according to the available data) and Abstracts Views on Vision4Press platform.
Data correspond to usage on the plateform after 2015. The current usage metrics is available 48-96 hours after online publication and is updated daily on week days.
Initial download of the metrics may take a while.