Fig. 10
Download original image
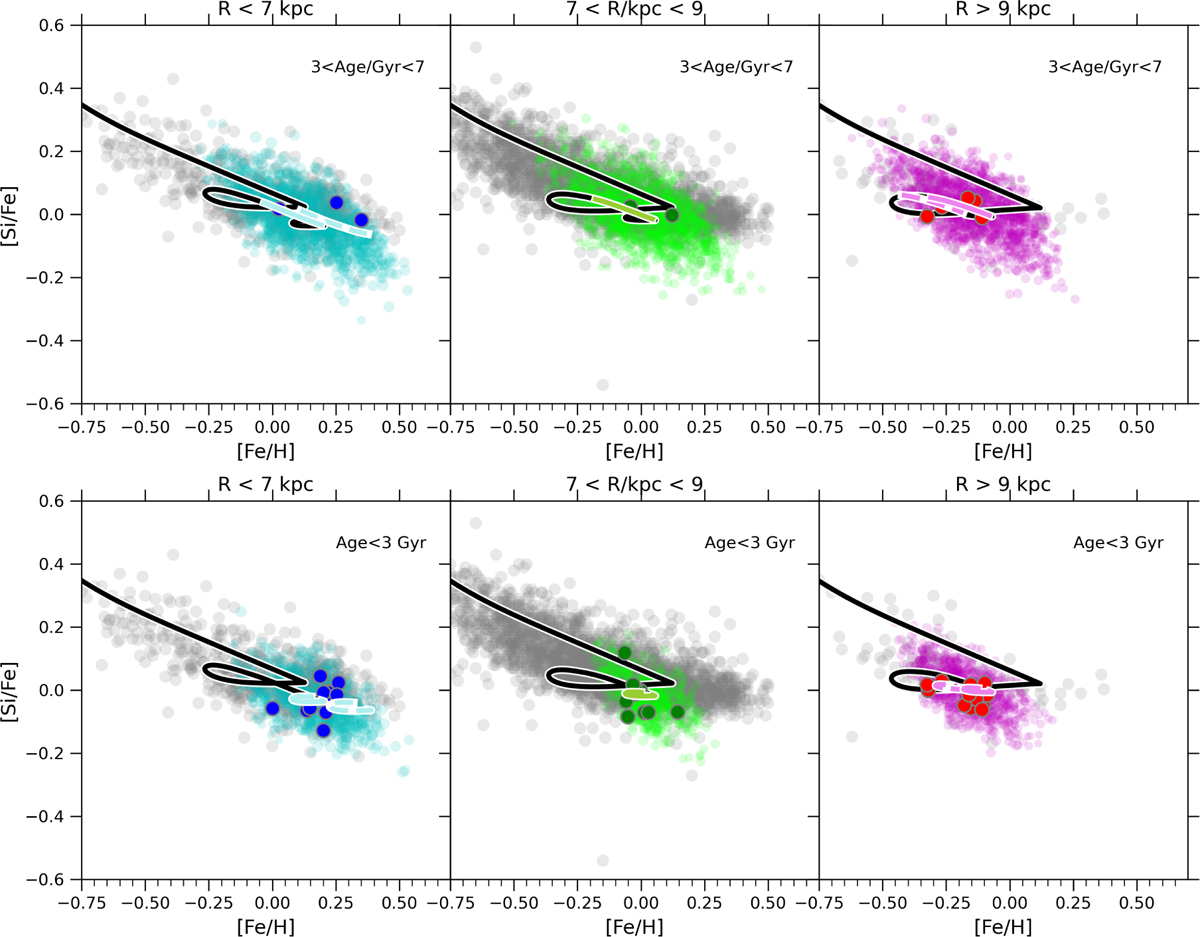
[Si/Fe] versus [Fe/H] evolution for the model 3INF-2 in different radial ranges, namely: R < 7 kpc (left panels), 7 < R/kpc < 9 (central panels), and R > 9 kpc (right panels). The upper panels show results for ages> 3 Gyr, while the lower panels for ages< 3 Gyr. The shaded cyan, light green, and magenta areas are the model prediction in a certain radial range taking into account the effect of stellar migration and OC spread (see Section 3.4). The solid lines represent genuine chemical evolution tracks at 6, 8, and 10 kpc and are colored in the age range considered in the respective panel. Colored dashed lines are the same as colored solid lines but for the radii of 4 kpc (left panels) and 12 kpc (right panel). Colored filled circles represent the restricted sample within OCs in Magrini et al. (2023). Grey points are selected field stars from the Gaia-ESO survey.
Current usage metrics show cumulative count of Article Views (full-text article views including HTML views, PDF and ePub downloads, according to the available data) and Abstracts Views on Vision4Press platform.
Data correspond to usage on the plateform after 2015. The current usage metrics is available 48-96 hours after online publication and is updated daily on week days.
Initial download of the metrics may take a while.