Fig. 1
Download original image
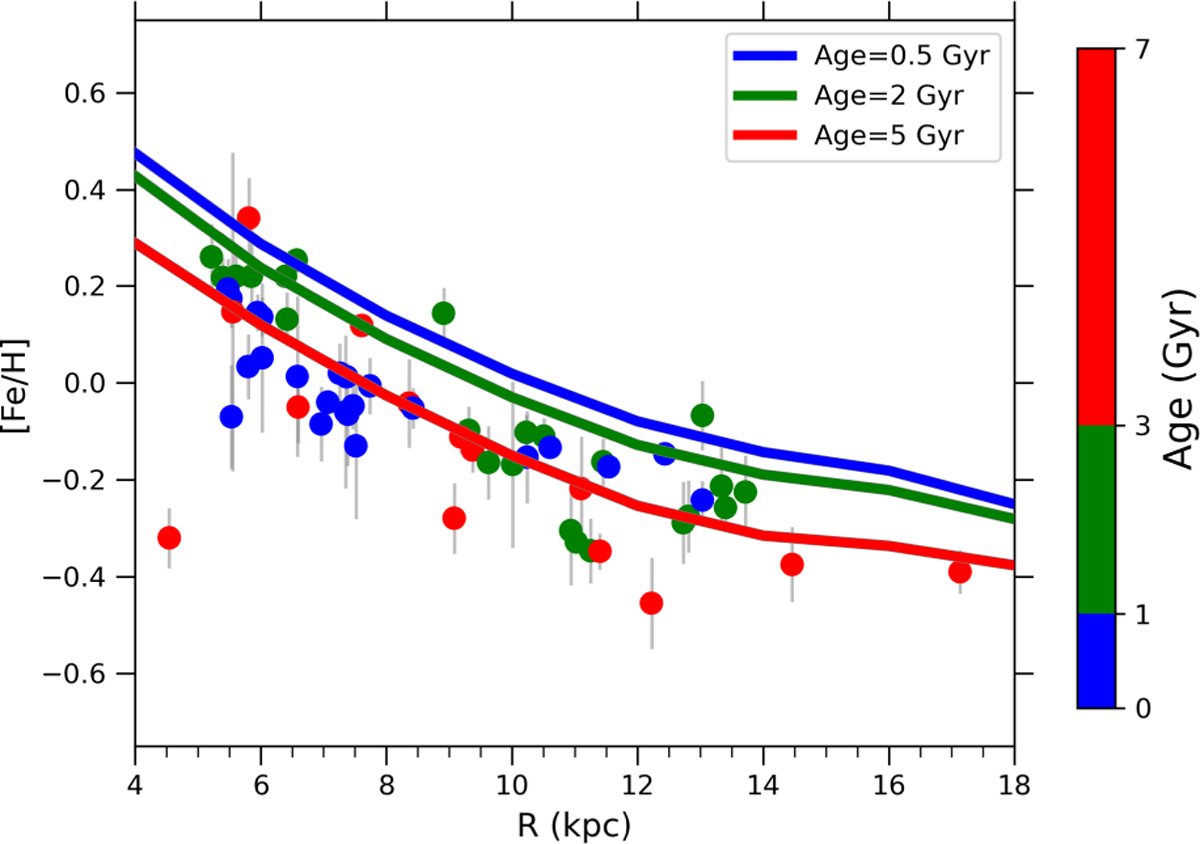
Time evolution of the radial [Fe/H] gradient as predicted by the two-infall model. Filled circles with errorbars are the OC sample by Magrini et al. (2023), which are divided in three age bins: young (Age < 1 Gyr, blue points), intermediate (1 < Age/Gyr < 3, green points), and old (Age > 3 Gyr, red points). Solid lines are the results for the [Fe/H] gradient, as predicted by the two-infall model at 0.5 Gyr (blue lines), 2 Gyr (green lines), and 5 Gyr (red lines). In this plot, and in the following Figures, we use the guiding radius of the orbit, computed as the average between the Apogalacticon and Perigalacticon radii (see Section 2.1), as an indication of the location of each cluster in the disk.
Current usage metrics show cumulative count of Article Views (full-text article views including HTML views, PDF and ePub downloads, according to the available data) and Abstracts Views on Vision4Press platform.
Data correspond to usage on the plateform after 2015. The current usage metrics is available 48-96 hours after online publication and is updated daily on week days.
Initial download of the metrics may take a while.