Fig. 2
Download original image
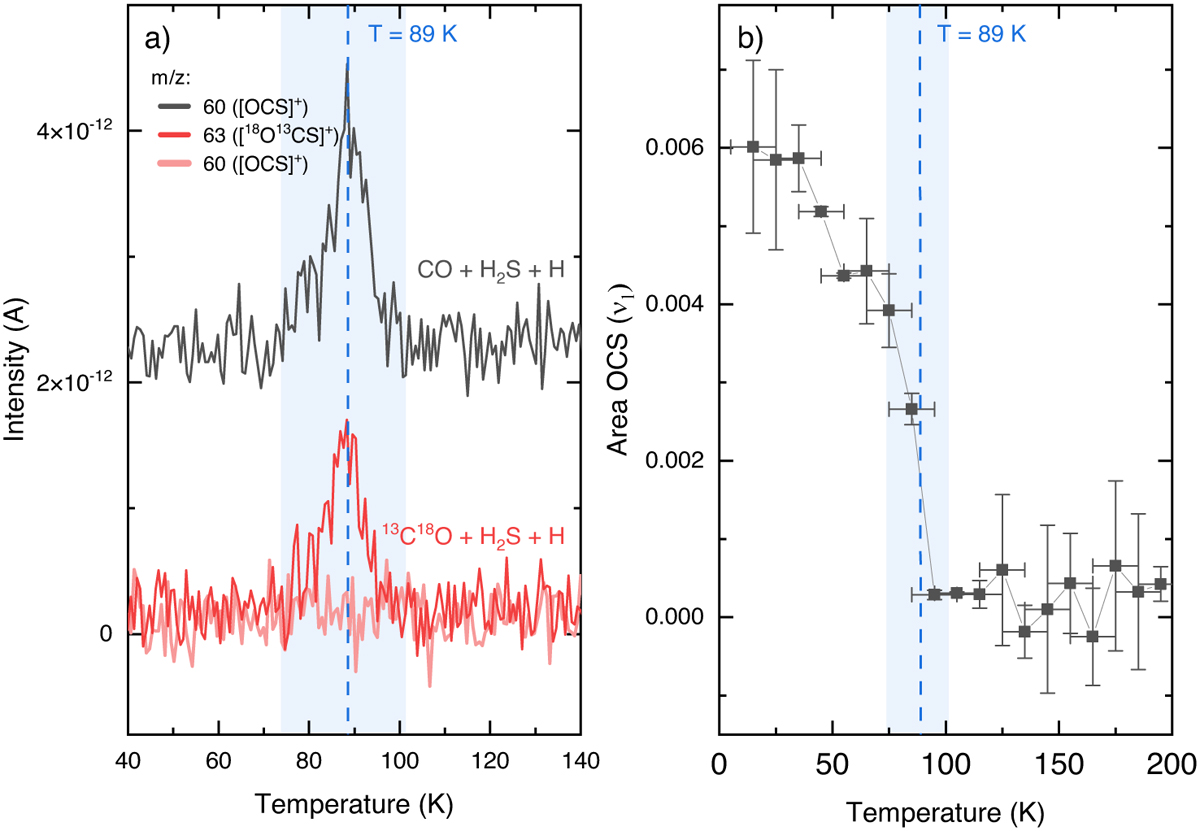
Complementary QMS and infrared data acquired during TPD confirming the OCS detection. Panel a: TPD-QMS signal recorded for m/z = 60 after the deposition of CO + H2S + H (experiment 1, gray), as well as those for m/z = 63 (dark red) and m/z = 60 (light red) after the deposition of 13C18O + H2S + H (experiment 3). The blue shadowed region denotes the range of desorption, and the dashed line highlights the peak desorption temperature. Signals from different experiments are offset for clarity. Panel b: area of the OCS v1 band as a function of temperature during TPD following the deposition of experiment 1. The uncertainties in the horizontal axis are due to the substrate temperature variation of ~10 K during the collection of each IR TPD spectrum. The blue shadowed area and dashed line are reproductions of the range and peak position shown in panel a.
Current usage metrics show cumulative count of Article Views (full-text article views including HTML views, PDF and ePub downloads, according to the available data) and Abstracts Views on Vision4Press platform.
Data correspond to usage on the plateform after 2015. The current usage metrics is available 48-96 hours after online publication and is updated daily on week days.
Initial download of the metrics may take a while.