Fig. 1
Download original image
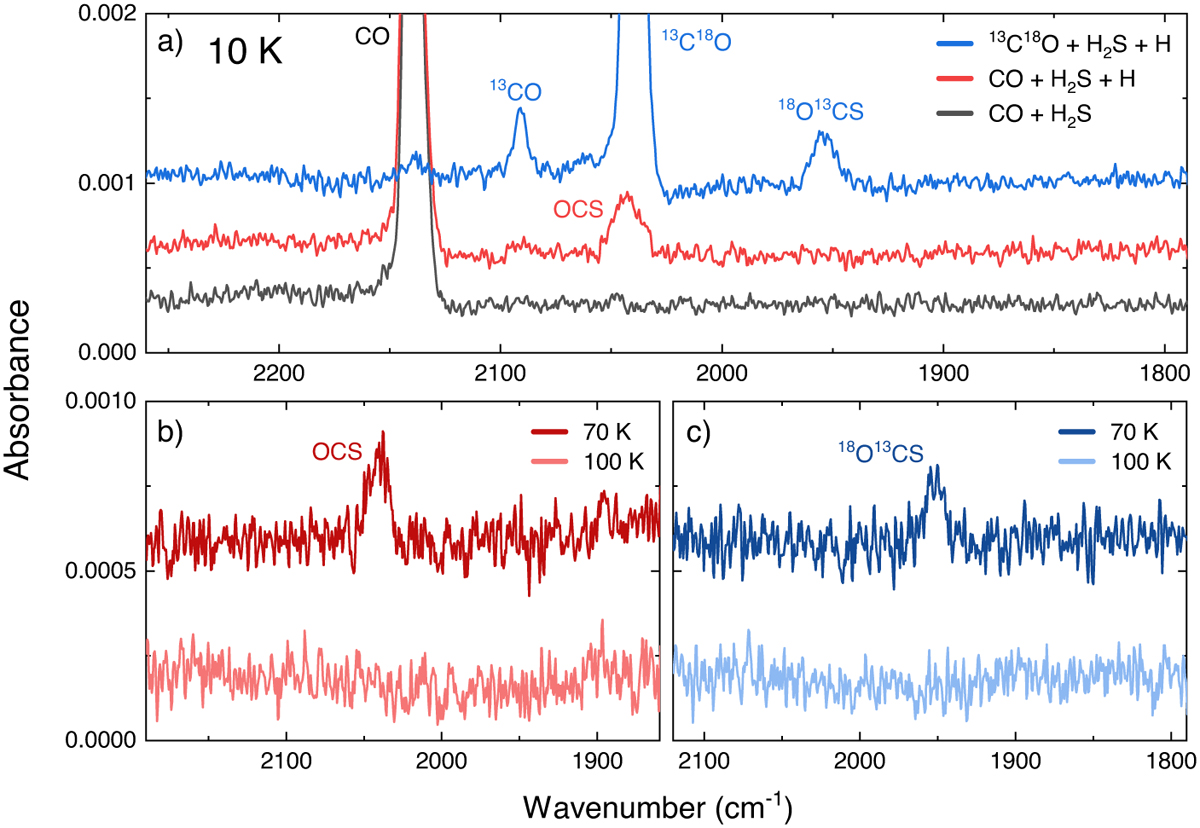
Infrared data confirming the formation of OCS from CO, H2S, and H atoms. Panel a: spectrum collected after deposition of CO + H2S + H (experiment 1, red) together with the control experiment without H atoms (experiment 2, gray) and the isotope-labeled experiment with 13C18O (experiment 3, blue). Small features assigned to 13CO and 12CO are due to minor contaminations from the gas bottle (respectively, ~4% and ~2% with respect to 13C18O). Panel b: infrared spectra acquired during TPD following the deposition of experiment 1. The spectrum in dark red (upper) is taken at ~70 K, and the one in light red (lower) is taken at ~100 K. Panel c: same as panel b, but for the isotope-labeled experiment. In all panels, only the relevant frequency range is shown and the spectra are offset for clarity.
Current usage metrics show cumulative count of Article Views (full-text article views including HTML views, PDF and ePub downloads, according to the available data) and Abstracts Views on Vision4Press platform.
Data correspond to usage on the plateform after 2015. The current usage metrics is available 48-96 hours after online publication and is updated daily on week days.
Initial download of the metrics may take a while.