Fig. 7
Download original image
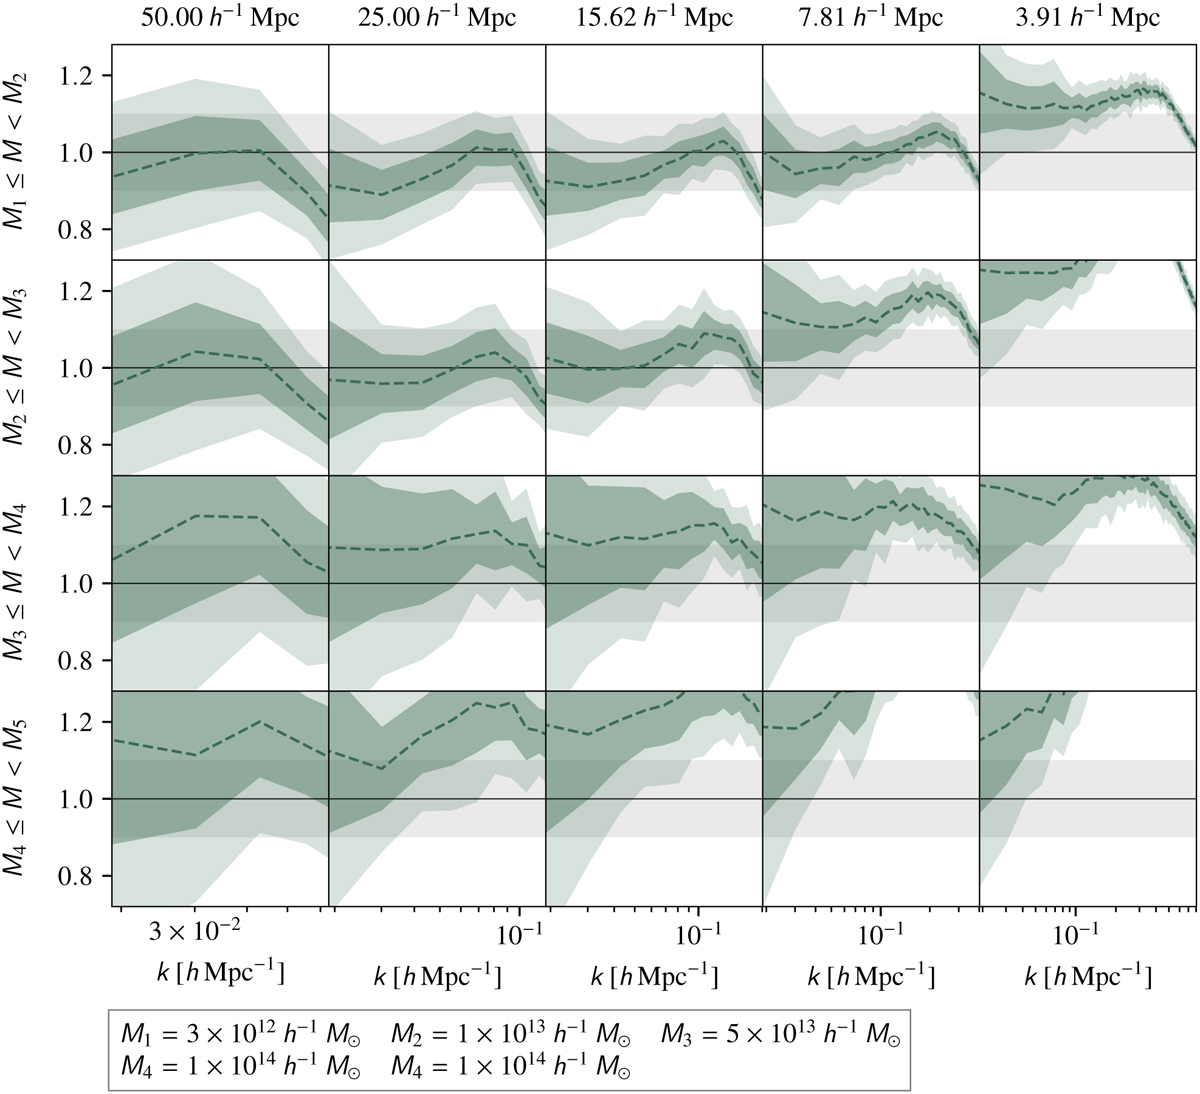
Ratios between the power spectrum of the PineTree mocks and the validation catalogues for different mass bins and at voxel resolutions. For the subplots shown from left to right, the voxel size is decreasing according to the Table 1 and also indicated by the annotations in the top row. From top to bottom, each row shows the ratio for increasing mass bins. As with all previous figures, the quantities shown here were all computed using an ensemble of 30 fields.
Current usage metrics show cumulative count of Article Views (full-text article views including HTML views, PDF and ePub downloads, according to the available data) and Abstracts Views on Vision4Press platform.
Data correspond to usage on the plateform after 2015. The current usage metrics is available 48-96 hours after online publication and is updated daily on week days.
Initial download of the metrics may take a while.