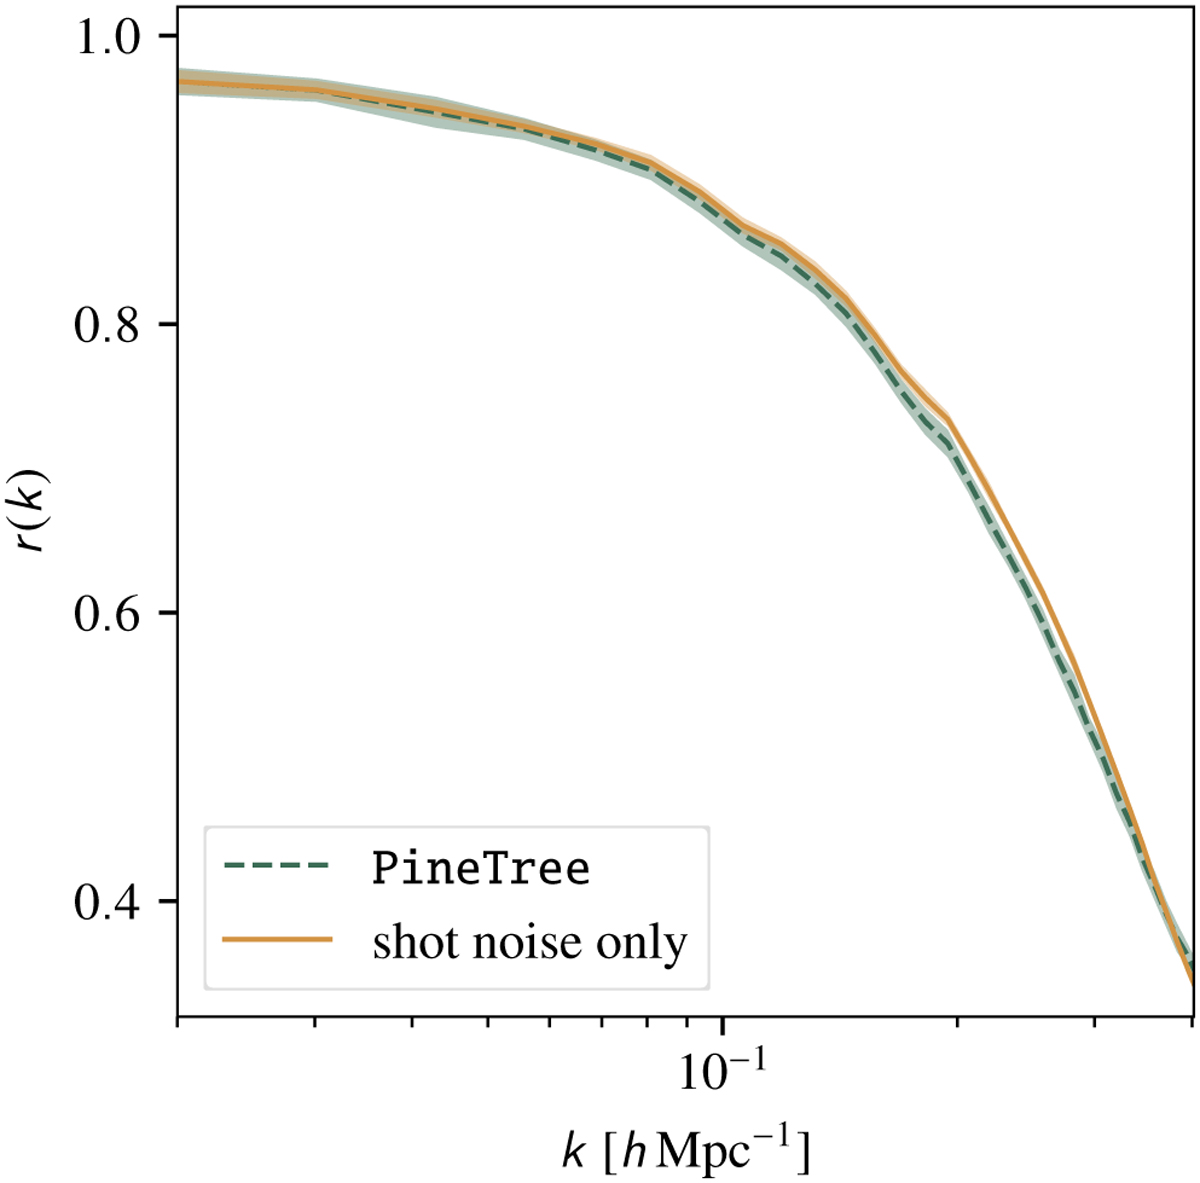
Fig. 6
Download original image
Cross-correlation coefficient comparison for halos with masses between 3 × 10¹² h−1 M⊙ and 1 × 10¹³ h−1 M⊙ at a 7.81 h−1 Mpc voxel resolution from 30 validation samples. The dashed green line shows the mean for the cross-correlation coefficient from the mock fields, while the mean of idealised fields with only Poisson noise contributions is depicted in solid orange. The shaded coloured area shows the 1 σ region, respectively.
Current usage metrics show cumulative count of Article Views (full-text article views including HTML views, PDF and ePub downloads, according to the available data) and Abstracts Views on Vision4Press platform.
Data correspond to usage on the plateform after 2015. The current usage metrics is available 48-96 hours after online publication and is updated daily on week days.
Initial download of the metrics may take a while.