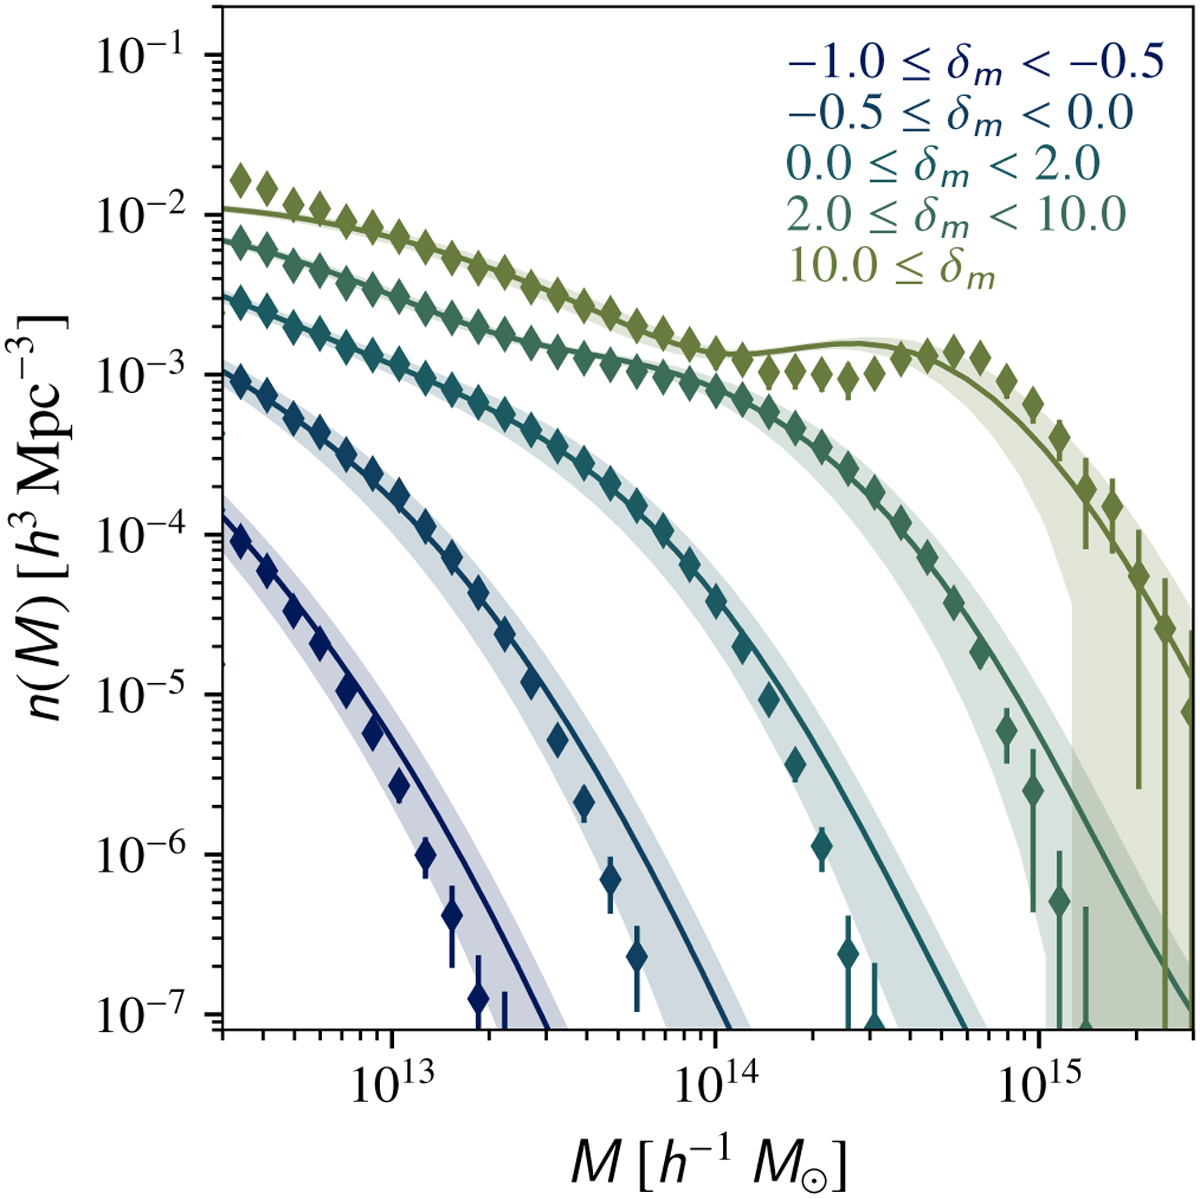
Fig. 5
Download original image
Mean conditional halo mass functions predicted by the PineTree model in solid lines and the halo mass function estimated from N-body simulations depicted in diamonds. The different colours correspond to different underlying DM overdensity bins that are specified by the legend in the figure. Error bars correspond to the 1 σ deviation and are presented as solid vertical lines or as shaded regions for the N-body estimates and PineTree predictions, respectively.
Current usage metrics show cumulative count of Article Views (full-text article views including HTML views, PDF and ePub downloads, according to the available data) and Abstracts Views on Vision4Press platform.
Data correspond to usage on the plateform after 2015. The current usage metrics is available 48-96 hours after online publication and is updated daily on week days.
Initial download of the metrics may take a while.