Fig. 4
Download original image
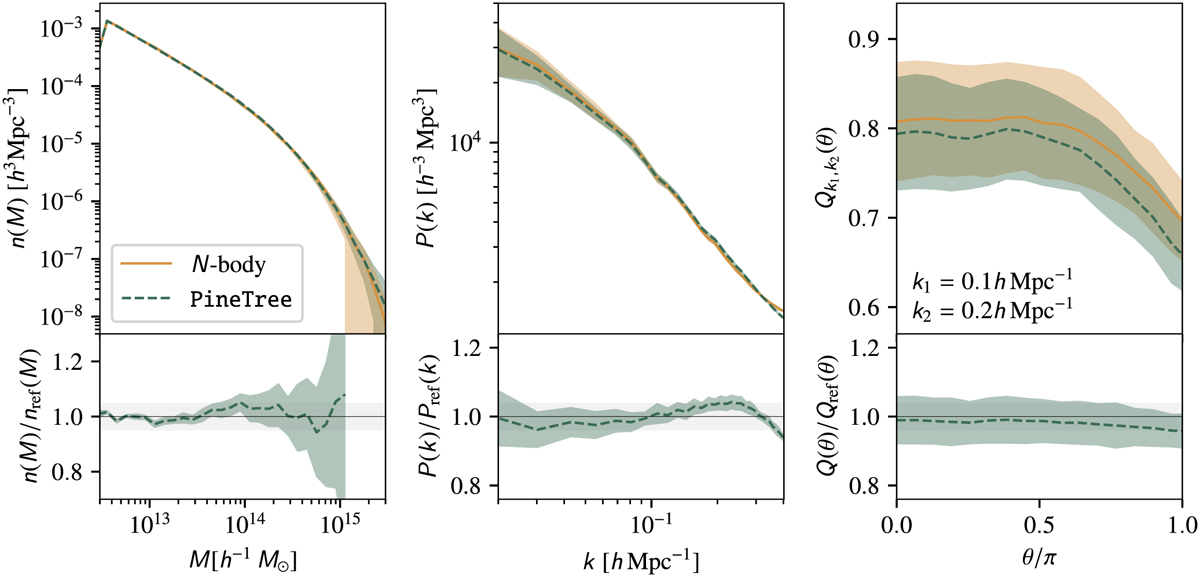
Marginal halo mass function, power spectrum, and reduced bispectrum from the left to right panel for halo density fields with a virial mass between 3 × 10¹² h−1 M⊙ and 1 × 10¹³ h−1 M⊙ at a 7.81 h−1 Mpc voxel resolution. All curves were obtained from 30 catalogues, with the dashed green and the solid orange line representing the ensemble mean of PineTree mocks and validation data, respectively. The 1 σ line is outlined by the coloured shaded regions. The bottom subplot in each panel shows the ratio of the respective summary statistic between the mock and validation set where the shaded grey region is the 5% deviation threshold.
Current usage metrics show cumulative count of Article Views (full-text article views including HTML views, PDF and ePub downloads, according to the available data) and Abstracts Views on Vision4Press platform.
Data correspond to usage on the plateform after 2015. The current usage metrics is available 48-96 hours after online publication and is updated daily on week days.
Initial download of the metrics may take a while.