Fig. B.2
Download original image
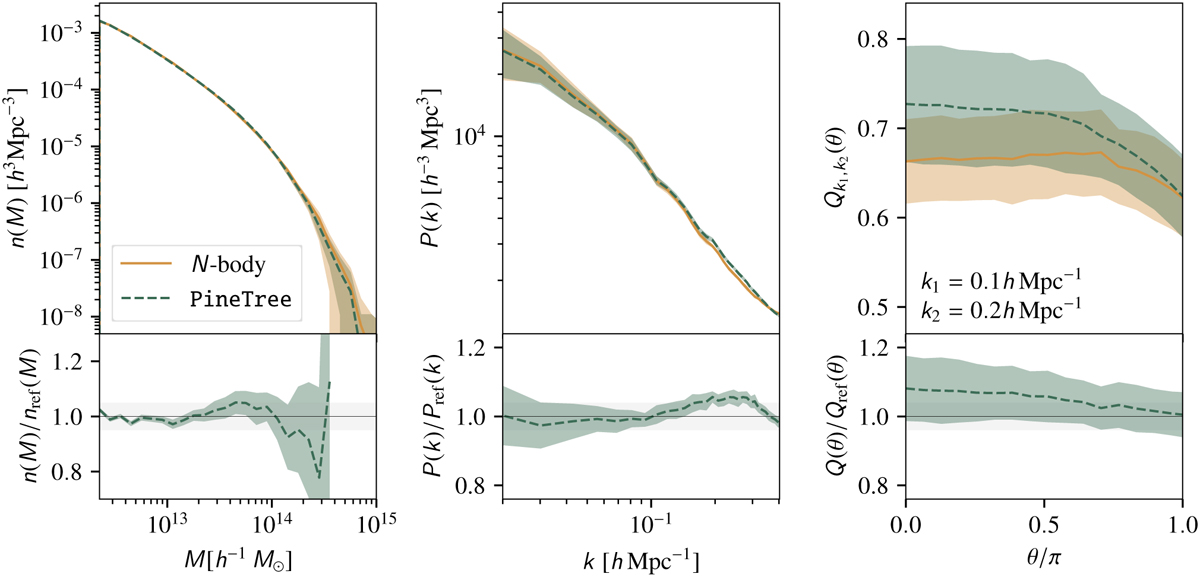
Same as Fig. 4 but with halos at z = 1. Again, the panels from left to right show the marginal halo mass distribution, the power spectrum and the reduced bispectrum with the network mocks plotted in green while the reference from the N-body simulations are shown in orange. The bottom subplot of each panel depicts the ratio of the respective summary statistics. The power spectrum and reduced bispectrum are computed using halos with a virial mass between 3 × 10¹² h−1 M⊙ and 1 × 10¹³ h−1 M⊙.
Current usage metrics show cumulative count of Article Views (full-text article views including HTML views, PDF and ePub downloads, according to the available data) and Abstracts Views on Vision4Press platform.
Data correspond to usage on the plateform after 2015. The current usage metrics is available 48-96 hours after online publication and is updated daily on week days.
Initial download of the metrics may take a while.