Open Access
Fig. 10
Download original image
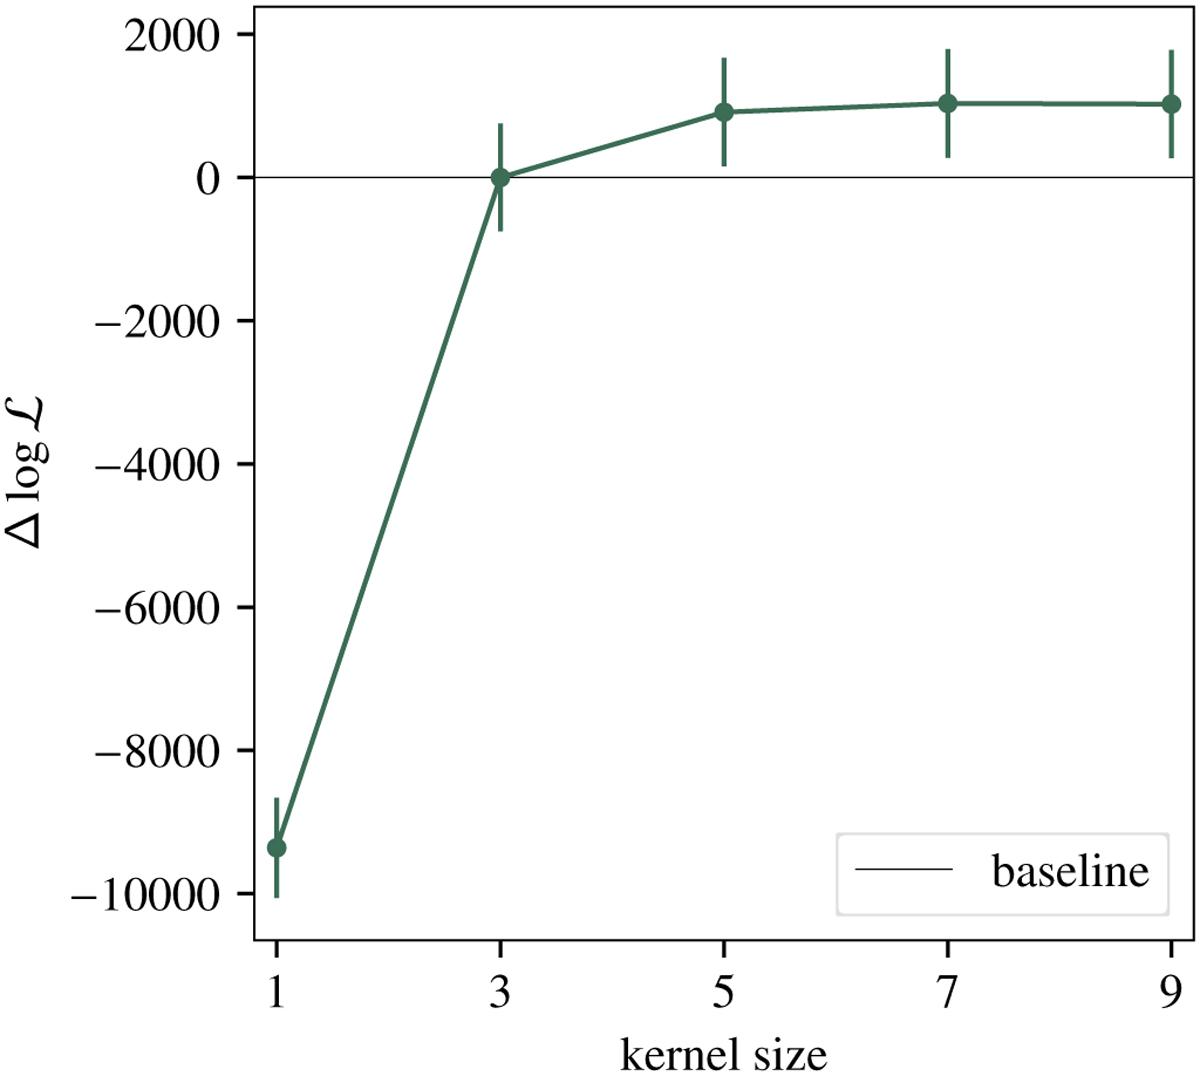
Mean log-likelihood difference computed from the 30 validation simulations for PineTree with varying kernel sizes. The horizontal black line indicates the baseline model and represents the 3 × 3 × 3 kernel set-up. Error bars for each point indicate the 1 σ deviation obtained from the validation set.
Current usage metrics show cumulative count of Article Views (full-text article views including HTML views, PDF and ePub downloads, according to the available data) and Abstracts Views on Vision4Press platform.
Data correspond to usage on the plateform after 2015. The current usage metrics is available 48-96 hours after online publication and is updated daily on week days.
Initial download of the metrics may take a while.