Fig. 6.
Download original image
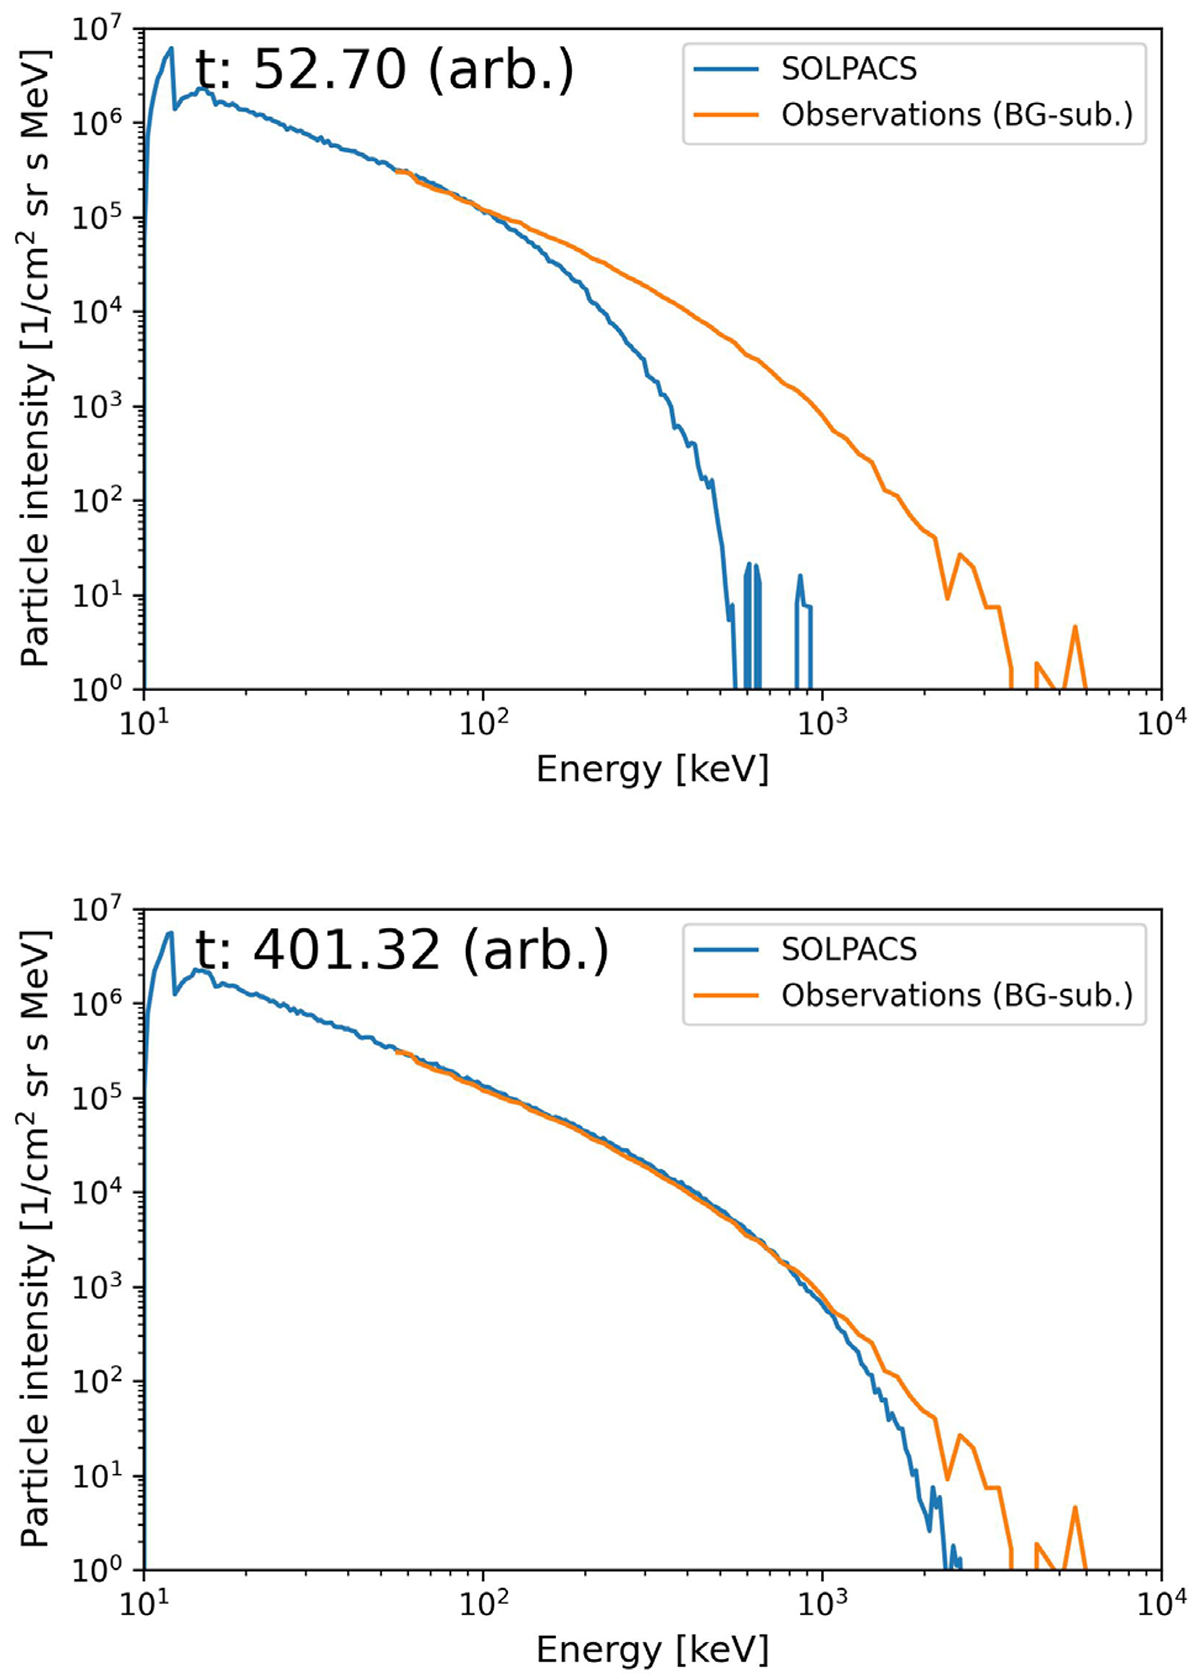
Particle energy spectra of the SOLPACS simulation results for the monoenergetic injection case with a particle injection energy of 10 keV and observational data from Solar Orbiter/EPT. The background particle intensity shown in Fig. 5 has been subtracted from the observational data. The time of the simulation snapshot is shown in arbitrary units at the top. The top panel shows an intermediate snapshot of simulation progress, where the particles have not yet had the time to be accelerated to high enough energies to match the observations. The bottom panel shows the simulation steady state, where close correspondence to the observations can be seen.
Current usage metrics show cumulative count of Article Views (full-text article views including HTML views, PDF and ePub downloads, according to the available data) and Abstracts Views on Vision4Press platform.
Data correspond to usage on the plateform after 2015. The current usage metrics is available 48-96 hours after online publication and is updated daily on week days.
Initial download of the metrics may take a while.