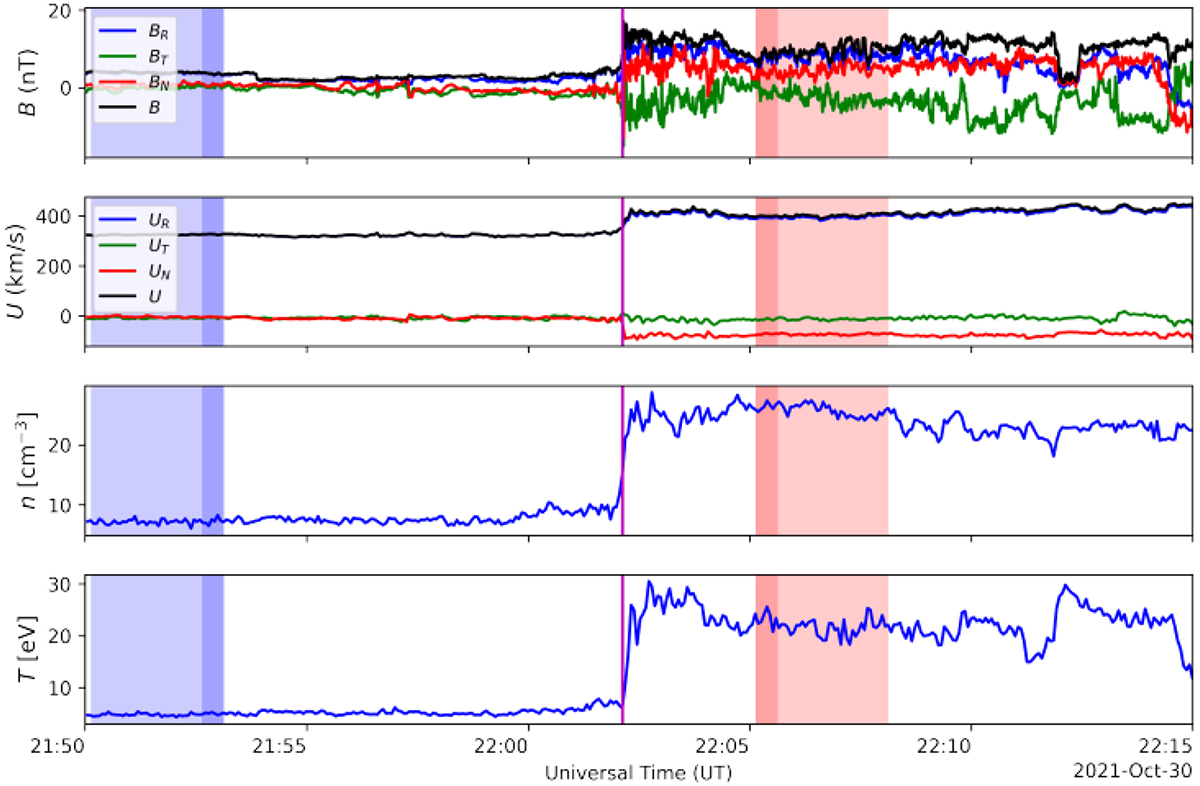
Fig. A.2.
Download original image
Zoomed-in image on a roughly 30 min window around the shock passing of SWA plasma data and MAG magnetic field data. The lighter blue window upstream of the shock shows the largest averaging window for the shock parameters, while the darker blue shows the smallest window. The red boxes on the downstream side correspondingly show the same things.
Current usage metrics show cumulative count of Article Views (full-text article views including HTML views, PDF and ePub downloads, according to the available data) and Abstracts Views on Vision4Press platform.
Data correspond to usage on the plateform after 2015. The current usage metrics is available 48-96 hours after online publication and is updated daily on week days.
Initial download of the metrics may take a while.