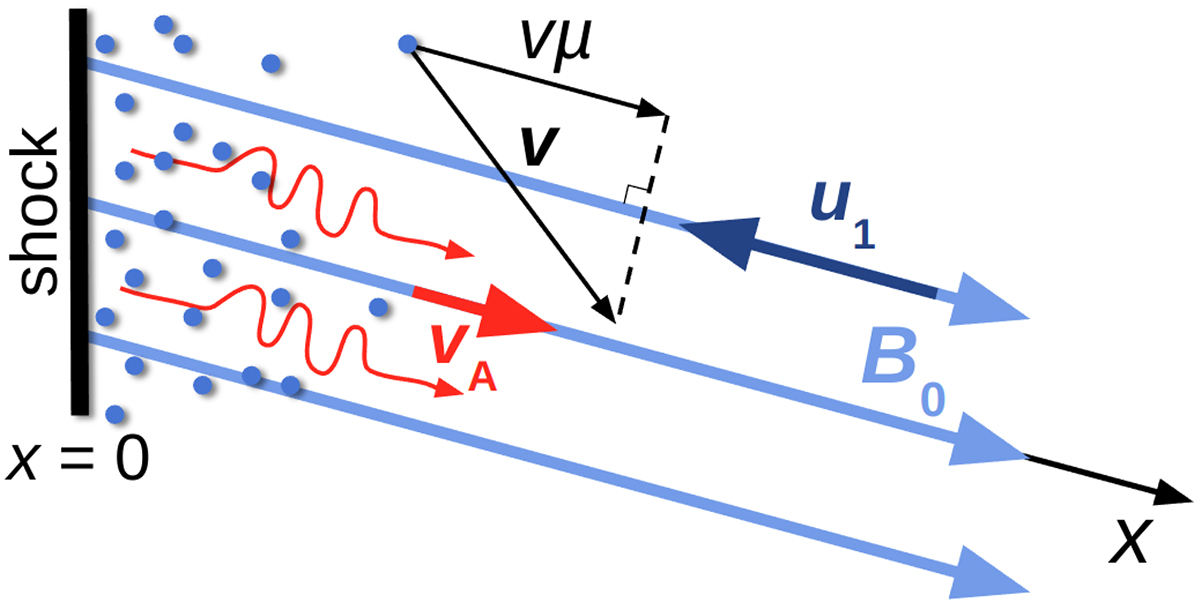
Fig. 1.
Download original image
SOLPACS simulation geometry. Protons (blue dots) and their velocity and speed along x (black), Alfvén waves (red), and the upstream plasma flow (dark blue arrow) and the magnetic field (light blue arrows) are depicted in the de Hoffmann–Teller frame, where the shock is at the origin x = 0. The coordinate system has been chosen so that the x-coordinate is along the magnetic field lines.
Current usage metrics show cumulative count of Article Views (full-text article views including HTML views, PDF and ePub downloads, according to the available data) and Abstracts Views on Vision4Press platform.
Data correspond to usage on the plateform after 2015. The current usage metrics is available 48-96 hours after online publication and is updated daily on week days.
Initial download of the metrics may take a while.