| Issue |
A&A
Volume 690, October 2024
|
|
|---|---|---|
| Article Number | A309 | |
| Number of page(s) | 9 | |
| Section | Astrophysical processes | |
| DOI | https://doi.org/10.1051/0004-6361/202451248 | |
| Published online | 18 October 2024 | |
Searching for redshifted 2.2 MeV neutron-capture lines from accreting neutron stars: Theoretical X-ray luminosity requirements and INTEGRAL/SPI observations
1
Institut für Astronomie und Astrophysik, Kepler Center for Astro and Particle Physics, University of Tuebingen, Sand 1, 72076
Tübingen, Germany
2
ISDC Data Center for Astrophysics, Université de Genève, 16 chemin d’Écogia, 1290
Versoix, Switzerland
3
INAF – Osservatorio Astronomico di Brera, via Bianchi 46, 23807
Merate (LC), Italy
4
Department of Physics and Astronomy, University of Turku, 20014
Turku, Finland
5
Astrophysics, Department of Physics, University of Oxford, Denys Wilkinson Building, Keble Road, Oxford, OX1 3RH
UK
Received:
25
June
2024
Accepted:
2
September
2024
Accreting neutron stars (NSs) are expected to emit a redshifted 2.2 MeV line due to the capture of neutrons produced through the spallation processes of 4He and heavier ions in their atmospheres. Detecting this emission would offer an independent method for constraining the equation of state of NSs and provide valuable insights into nuclear reactions occurring in extreme gravitational and magnetic environments. Typically, a higher mass accretion rate is expected to result in a higher 2.2 MeV line intensity. However, when the mass accretion rate approaches the critical threshold, the accretion flow is decelerated by the radiative force, leading to a less efficient production of free neutrons and a corresponding drop in the flux of the spectral line. This makes the brightest X-ray pulsars unsuitable candidates for γ-ray line detection. In this work, we present a theoretical framework for predicting the optimal X-ray luminosity required to detect a redshifted 2.2 MeV line in a strongly magnetized NS. As the INTErnational Gamma-Ray Astrophysics Laboratory (INTEGRAL) mission nears its conclusion, we have undertaken a thorough investigation of the SPectrometer on board INTEGRAL (SPI) data of this line in a representative sample of accreting NSs. No redshifted 2.2 MeV line was detected. For each spectrum, we have determined the 3σ upper limits of the line intensity, assuming different values of the line width. Although the current upper limits are still significantly above the expected line intensity, they offer valuable information for designing future gamma-ray telescopes aimed at bridging the observational MeV gap. Our findings suggest that advancing our understanding of the emission mechanism of the 2.2 MeV line, as well as the accretion flow responsible for it, will require a substantial increase in sensitivity from future MeV missions. For example, for a bright X-ray binary such as Sco X−1, we would need at least a 3σ line point source sensitivity of ≈10−6 ph cm−2 s−1, that is, about two orders of magnitude better than that currently achieved.
Key words: accretion / accretion disks / nuclear reactions / nucleosynthesis / abundances / binaries: general / stars: neutron
© The Authors 2024
 Open Access article, published by EDP Sciences, under the terms of the Creative Commons Attribution License (https://creativecommons.org/licenses/by/4.0), which permits unrestricted use, distribution, and reproduction in any medium, provided the original work is properly cited.
This article is published in open access under the Subscribe to Open model. Subscribe to A&A to support open access publication.
1. Introduction
A seminal paper by Shvartsman (1970) showed that accreting neutron stars (NSs) are not merely X-ray emitters; the accreting matter can also produce spectral features in the MeV band. These spectral features are possible because, as matter falls onto a NS, its kinetic energy can exceed the binding energy of nucleons within nuclei, leading to their disintegration upon atmospheric entry. A fraction of the accreting ions can thus produce nuclear reactions in the external layer of the NS, yielding γ-ray line emission. One of the γ-ray production channels produces the emission of 2.2 MeV photons as a result of the capture of neutrons by protons. This idea was further developed in subsequent studies by Reina et al. (1974) and Brecher & Burrows (1980). Studies by Bildsten et al. (1992, 1993) continued to build on these works, advancing a more robust photon production mechanism, capable of determining the expected intensity of the 2.2 MeV emission line. The main aspects of this model are briefly described below.
The accreting nuclei (here, we are especially interested in 4He) slow down due to repeated Coulomb collisions with electrons in the NS atmosphere. Then, their collision with atmospheric protons results in the destruction of a significant fraction of the nuclei, with the consequent release of neutrons and 3He. The neutrons liberated in the spallation reactions continue to scatter elastically with protons, eventually thermalizing and drifting downwards under the influence of gravity. They can then be captured by protons, resulting in the emission of 2.2 MeV photons, or undergo charge exchange with 3He. Bildsten et al. (1993) pointed out that the production of 2.2 MeV photons is primarily from neutrons in excess of the 3He that is produced, as most 3He will absorb a neutron, leading to the production of a proton and 3H. The capture of the proton by a deuterium leads to a γ-ray with an energy of ∼5.49 MeV, while the capture of a proton by 3H produces a γ-ray with an energy of ∼19.81 MeV (see Bildsten et al. 1993, and references therein). Due to the high Compton optical depths within the NS atmosphere, only a fraction of the 2.2 MeV γ-rays manage to escape without scattering.
In their theoretical model, Bildsten et al. (1993) considered a scenario with a moderate magnetic field, where matter accretes radially onto the NS. In the presence of stronger magnetic fields, approximately ∼1012 G in accreting pulsars of high-mass X-ray binaries (see e.g. Mushtukov & Tsygankov 2022), the escape of these line photons from the NS is determined by the potential attenuation in their magnetosphere, whose leading process is the magnetic pair production. Çalişkan et al. (2009) provided a rough estimate for transparency to 2.2 MeV photons due to pair creation: for γ-ray photons to be observable, their origin must be at polar magnetic co-latitudes below approximately 20 degrees and they must be beamed within 15–20 degrees relative to the local surface magnetic field vector. These conditions restrict the likelihood of observing a 2.2 MeV emission line to small, yet non-negligible, probabilities. Since this line originates from the radially thin atmosphere of the NS, its detection would enable determination of the gravitational redshift and thus constrain the nuclear equation of state at high matter densities. The 2.2 MeV emission line produced in NSs is also expected to be broadened, due to gravitational and relativistic effects (Özel & Psaltis 2003). In summary, the 2.2 MeV emission line has the potential to be a crucial spectroscopic tool in the study of high-energy environments at the surfaces and in the interiors of NSs. Detecting this line could provide valuable insights into nuclear reactions occurring in accretion flows within environments characterized by strong gravitational and magnetic fields.
While the redshifted 2.2 MeV line from the surface of the accreting NS is the focus of our work here, we briefly mention a few other potential origins of the 2.2 MeV line emission, in the interest of thoroughness. These include lines originating from the hot inner region of accretion discs around black holes (Aharonian & Sunyaev 1984), narrow lines resulting from neutron capture on the surface of the donor star in the binary system (Jean & Guessoum 2001; Guessoum & Jean 2002, 2004), and emission of the ∼2.22 MeV line due to very high energy protons impacting the surface of the donor star (Vestrand 1989).
Studies have been carried out to search for narrow, unredshifted 2.2 MeV line emission. Harris & Share (1991) placed initial constraints on 2.2 MeV emissions from the low-mass X-ray binary Scorpius X-1 (Sco X-1) at 10−4 ph cm−2 s−1 using data from the Solar Maximum Mission. Subsequently, a comprehensive all-sky survey for 2.2 MeV emissions was carried out with the Compton Telescope (COMPTEL) aboard the Compton Gamma Ray Observatory. This survey provided tighter constraints on several X-ray binaries (XRBs) including an upper limit on the emission from Sco X-1 of 2.5 × 10⁻⁵ ph cm−2 s−1 as reported by McConnell et al. (1997). The study by Teegarden & Watanabe (2006) reported less stringent upper limits on emission lines from various XRBs, utilizing the initial year of data from INTEGRAL/SPI. The redshifted 2.2 MeV line from A 0535+26 has been the subject of studies by Boggs & Smith (2006) and Çalişkan et al. (2009). This target was selected because the pulsar in A 0535+26 is relatively slow (∼100 s; Rosenberg et al. 1975), and hence the rotational broadening should be negligible. Boggs & Smith (2006) analysed data collected by the Reuven Ramaty High Energy Solar Spectroscopic Imager (RHESSI) during a giant outburst in 2005, while Çalişkan et al. (2009) examined INTEGRAL/SPI data from a fainter outburst that occurred the same year, three months after the major event. Neither study detected the redshifted 2.2 MeV line; both were only able to establish width-dependent upper limits ranging from (2 − 11)×10−4 ph cm−2 s−1.
Given the importance of detecting the redshifted 2.2 MeV neutron-capture line emission, in Sect. 2 we present a theoretical framework that provides, for the first time, the optimal X-ray luminosity for the production of 2.2 MeV photons from a highly magnetized accreting NS. In Sect. 3 we present the most comprehensive analysis of INTEGRAL/SPI data on the subject to date. Our analysis consists of searching for an emission line in the ∼1 − 2.2 MeV energy band using approximately 20 years of SPI data from observations of a representative sample of accreting NSs. The results are presented in Sect. 4 and discussed in Sect. 5.
2. Critical luminosity effects on 2.2 MeV line emission in highly magnetized NSs
The theory of the emission of the 2.2 MeV line from accreting NSs (see the references in the Introduction) was developed mainly for stars with a weak magnetic field. An extremely strong magnetic field, ≳1011 G, usually observed in X-ray pulsars (XRPs), should result in significant changes to the model. Detailed modification of the existing theory is a topic for a separate publication. Here, however, we do discuss one of the most important effects, which relates to the existence of the critical luminosity (Basko & Sunyaev 1976; Becker et al. 2012; Mushtukov et al. 2015a), when the accretion flow can be decelerated above the stellar surface as a result of its interaction with X-ray photons.
2.1. Simplified model for non-magnetic NSs
Since the appearance of the 2.2 MeV γ-ray photons is a result of neutron capture by protons following the destruction of helium atoms, the γ-ray line flux is expected to be proportional to the accretion rate of 4He nuclei onto a NS surface (Bildsten et al. 1993). As a result, both X-ray flux, FX, and the γ-ray line flux, Fn, 2.2 MeV, are scaled linearly with the mass accretion rate. The flux of the 2.2 MeV photon number can be estimated as
where Y is the mass fraction of 4He atoms in the accretion flow, Q is the number of unscattered 2.2 MeV photons escaping the NS atmosphere per one atom of accreted helium, and the total X-ray energy flux,
is determined by the accretion rate of baryons Ṅb, by the kinetic energy of a baryon entering the NS atmosphere,
and by the distance to the source, d. Estimations (1) and (2) assume that the beam patterns in X-ray and the γ-ray line are similar and isotropic1.
Assuming a linear relation between the X-ray energy flux and the flux in the γ-ray line and Q = 0.2 in Eq. (1), Bildsten et al. (1993) estimated an upper limit to the expected 2.2 MeV γ-ray line photon flux from an accreting NS:
However, the upper limit (4) can be significantly higher than the real flux in the 2.2 MeV line, because Q = 0.2 does not take several factors into account, namely, that not all of the accreted neutrons are liberated from their nuclei, that neutrons tend to thermalize at large depths in the atmosphere, and that a large fraction of neutrons are absorbed by 3He nuclei. Bildsten et al. (1993) provided more accurate estimations for Q at different infall energies of the nucleus Ei (see Table 4 in Bildsten et al. 1993). For the kinetic energy Ei ≈ 162 MeV, corresponding to the free-fall velocity at MNS = 1.4 M⊙ and RNS = 12 km NS surface, Q ≈ 10−2. Thus, for convenience, Eq. (4) can be re-written to show the expected γ-ray line flux:
2.2. Optimal luminosity of an XRP for the emission of 2.2 MeV photons
The efficiency of 2.2 MeV photon production per one 4He atom accreted onto the NS surface is dependent on the kinetic energy of the atom and decreases as the kinetic energy becomes smaller. The number of unscattered 2.2 MeV photons escaping the NS atmosphere per one atom of accreted helium can be roughly approximated2 as (see Table 4 in Bildsten et al. 1993)
![$$ \begin{aligned} Q\approx 0.04\,\exp \left[ -\frac{300}{E_{\mathrm{i, MeV}}^{1.1}} \right], \end{aligned} $$](/articles/aa/full_html/2024/10/aa51248-24/aa51248-24-eq6.gif)
where Ei, MeV ≡ Ei/1 MeV. The kinetic energy of particles entering a stellar atmosphere depends on the star’s mass and radius (see Eq. (3)), but at high mass accretion rates, the luminosity and radiative force are large enough to decelerate accretion flow above the stellar surface (Basko & Sunyaev 1976), which reduces the kinetic energy. At the critical luminosity Lcrit ∼ 1037 erg s−1, which is expected to be dependent on the magnetic field strength at the NS surface (Mushtukov et al. 2015a), the flow is completely decelerated due to its interaction with X-ray photons, that is, Ei = 0. At luminosities below the critical value, the velocity of accretion flow entering the atmosphere can be approximated as
where vff is the free-fall velocity (see Sect. 2 in Mushtukov et al. 2015b and Markozov et al. 2023 for the advanced calculations).
Therefore, a naive linear correlation between the X-ray flux and the flux in the 2.2 MeV line given by Eq. (5) is not valid for XRPs near or above the critical luminosity. Combining approximations (1), (6), and (7), we can estimate the luminosity and flux in the 2.2 MeV line for an XRP (see Fig. 1). At low mass accretion rates, the luminosity (and flux) in the 2.2 MeV line is expected to be linearly proportional to the total accretion luminosity, but drops very quickly as soon as the source reaches its critical luminosity. Therefore, the maximal luminosity of the 2.2 MeV line is achieved at L ∼ 0.5 Lcrit and is expected to be
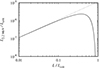 |
Fig. 1. Expected luminosity of the 2.2 MeV line, L2.2 MeV, as a function of the total accretion luminosity L of an XRP. Both axes are scaled by the critical accretion luminosity Lcrit. At low mass accretion rates and luminosity, the flux in the 2.2 MeV line is proportional to the total accretion luminosity. At high mass accretion rates, however, the radiative force decelerates the accretion flow above the NS surface, which results in a sharp drop in luminosity in the 2.2 MeV line. |
For a typical XRP with a magnetic field of the order of few × 1012 G and corresponding critical luminosity of around 1037 erg s−1, the optimal X-ray luminosity for detecting the redshifted 2.2 MeV line is ∼5 × 1036 erg s−1. The main process determining accretion flow deceleration in XRPs – namely, Compton scattering – is strongly affected by the magnetic field (Daugherty & Harding 1986). As a result, the critical luminosity is anticipated to be highly dependent on the surface magnetic field strength of a NS, following the relation Lcrit ∝ B02 for B0 ≳ 4 × 10¹² G. The primary uncertainties in determining the critical luminosity, given a known surface field strength, stem from the geometry of the accretion channel at the NS surface (it can be affected by global geometry of the NS magnetic field and the dipole magnetic field inclination with respect to the plane of the accretion disc) and the polarization composition of the X-rays emitted by the atmosphere of a NS (see Fig. 5ce in Mushtukov et al. 2015a).
3. Data analysis
We searched for the presence of a redshifted 2.2 MeV line in SPI observations of accreting pulsars. SPI (Vedrenne et al. 2003) operates in the 20 keV−8 MeV energy range, with an energy resolution of ∼2.8 keV at 1.7 MeV (see e.g. Roques et al. 2003; Diehl et al. 2018). We performed the data reduction using the SPI Data Analysis Interface (spidai) software provided by the SPI team at the IRAP Toulouse3. Spectra are derived using a sky model-fitting procedure, with a background determined using a set of empty fields observations, called ‘flat fields’, roughly one per six months. The flat fields are pre-defined and are part of the spidai configuration. The spidai sky model fitting algorithm adopts the minimization of the χ2 statistics. Its application to Poisson-distributed count noise – as, in our case, it is for narrow bins at high energies – might underestimate the total number of counts (Mighell 1999). Therefore, the outcomes of the sky model setup were interpreted with due caution. In particular, we conducted an intermediate test to setup the sky model using fewer bins (five, on a logarithmic scale) from 20 keV to 2.2 MeV, which allowed for a higher number of counts per bin. These bins also include the energy range in which the sources are bright (≲100 keV), which helps determine the sources contributing to the total flux measured by SPI, thereby improving the input sky model. The sky model solutions, built on the basis of the intermediate step but now with many narrow bins in the range 20 keV−2.2 MeV, were then checked to detect any problems, such as anomalous high values of χ2 in individual energy and pointing4 channels (see e.g. Jourdain & Roques 2009 for a detailed description of the method). Pointings exhibiting unusually high background activity were excluded. We analysed public data where the targets selected for this work were within 12° from the centre of the SPI field of view.
We have listed the sources considered in this work in Table 1. These binary systems are located in uncrowded regions of the sky, which ensures a relatively simple sky model and therefore facilitates the possible detection of a faint spectral emission line. Four of these XRBs host a slow pulsating NS (spin period in the range of ∼100 − 800 s). We selected them because they are expected to produce a relatively narrow emission line (Özel & Psaltis 2003). On the other hand, the NSs in these four XRBs are highly magnetized (B ≳ 1012 G). Therefore, based on the results in Sect. 2.2, we considered only SPI observations where these sources exhibit Lx ≲ 0.5 Lcrit (see Fig. 1). These observations are summarized in Table 2.
Accreting NSs analysed in this study, along with their respective net exposure times for the SPI data, and the highest 3σ upper limits in the ranges 1−2.2 MeV (for a redshifted 2.2 MeV line) and 200–800 keV (for a 511 keV line), assuming different values of FWHM.
Time intervals of the observations analysed in this work.
A 0535+26 and GX 304−1 are transient Be/XRBs showing sporadic outbursts which can reach high luminosities (Lpeak > 1037 erg s−1). For these, we considered the rise and decay parts of the outbursts, where the X-ray luminosity is optimal for detecting the redshifted 2.2 MeV line. Vela X-1 is a persistent high-mass XRB, with an orbital period of ∼8.96 d and a long eclipse (Δϕ ≈ 0.1697). For this source, we considered all of the available public SPI data, excluding the eclipses according to the ephemeris reported in Falanga et al. (2015). X Persei (X Per) is a persistent Be/XRB with a pulsar (Pspin ≈ 835 s, White et al. 1976) accreting at a low rate (Lx ≈ 6 × 1034 erg s−1, assuming d = 600 pc; Reig & Roche 1999; Bailer-Jones et al. 2021). For this source we considered all of the available public SPI data. The fifth target of our study, Sco X-1, is a low-mass XRB with a NS accreting at a high rate (see e.g. Vrtilek et al. 1991). It has been considered in other previous observational and theoretical works (McConnell et al. 1997; Harris & Share 1991; Bildsten et al. 1993) on the 2.2 MeV emission line. Sco X-1 is probably a millisecond pulsar (although the pulsation has not yet been discovered; see Galaudage et al. 2022), which would lead to a very broad emission line (Özel & Psaltis 2003). In addition, it likely has a low magnetic field, allowing us to test the simplified model for the 2.2 MeV emission for non-magnetic NSs proposed by Bildsten et al. (1993) (Sect. 2.1). In the Appendix, we report the results of a complementary data analysis, using SPI observations of highly magnetized NSs in Be/XRBs during outbursts, that is, when the X-ray luminosity exceeds Lcrit, for which we expect highly inefficient neutron capture.
We extracted all of the spectra in the energy range of 20 keV to 2 MeV, which is the range enabled by the spidai software, using 500 bins defined on a linear scale. In the 400−2200 keV energy range (∼650 − 2200 keV until revolution 1170, in May 2012), the SPI data exhibit spectral artefacts due to high-energy particles that saturate the main electronic chain, known as the analogue front-end electronics (AFEE), resulting in false triggers. To circumvent this issue, we used the output from a second electronic chain, the pulse shape discriminator (PSD), which operates independently of the AFEE. The PSD sub-system has an efficiency of ∼85% within its energy domain, attributed to a relatively high dead time. To account for this efficiency, we applied a correction factor of 0.85 to the data and error bars for the energy band of the spectra acquired using the PSD (for more information, see Jourdain & Roques 2009; Roques & Jourdain 2019).
For the spectral analysis, we used xspec5 through PyXspec6.
4. Results
The spidai data reduction software produces background-subtracted spectra in which, for each channel, rate and its error are provided in counts per second. The top panel of Fig. 2 shows an example (A 0535+26) of one of these spectra. The spectra do not show any obvious hints indicating the presence of an emission line with a full width half maximum (FWHM) ≥ 10 keV. In all of the spectra, the rate shows a symmetric distribution around zero (see, for example, the histogram of the rate of the 1–2.2 MeV spectrum of A 0535+26 in Fig. 3). This is an effect that occurs when the background is subtracted, which is done when the contribution from the source is low or absent (see e.g. Siemiginowska 2011). The lower panel of Fig. 2 shows that the fluctuations around zero are much higher than those expected from the statistical errors, which are probably underestimated. We calculated systematic errors by empirically adding them in quadrature to the statistical errors until we obtained a reduced χ2 ∼ 1. The expected energy and profile of the line depend on gravitational and relativistic effects, although it is not possible to determine in advance exactly how much it will be redshifted and broadened (see Özel & Psaltis 2003, for a thorough discussion). Given these uncertainties, to estimate the 3σ upper limit of the line flux, we applied a method similar to that adopted by Boggs & Smith (2006) and Çalişkan et al. (2009). We fit each spectrum with a Gaussian over a grid of evenly spaced line energies and FWHMs. The energy varies from 1.0 MeV to 2.2 MeV, with steps of 5 keV, and the FWHMs are fixed to 10, 20, 40, and 100 keV. Table 1 shows, for each FWHM, the highest upper-limit values derived in the range 1–2.2 MeV. As an additional result, we report in Appendix B the upper limits of the fluxes we obtained in the 200–800 keV and 1000–2200 keV bands by fitting the spectra with a power law (pegpwrlw in xspec).
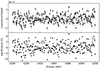 |
Fig. 2. SPI spectrum of A 0535+26, in the energy range 1–2.2 MeV. Upper panel: Background-subtracted spectrum of A 0535+26. Lower panel: Significance of the residuals as a function of energy. Uncertainties in these panels do not include systematic errors. |
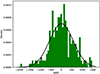 |
Fig. 3. Green histogram: Distribution of the rate of the spectrum of A 0535+26 (1–2.2 MeV). Black line: Best fit with a Gaussian function. |
5. Discussion
5.1. SPI upper limits vs. expectations
In Fig. 4 we present a comparison between the upper limits we measured and the expected emission line fluxes resulting from neutron capture on the surface of a NS. The upper limits refer to those obtained assuming FWHM = 10 keV. The expected redshifted 2.2 MeV line fluxes shown in this figure were obtained with Eqs. (4) (grey line) and (5) (black line) and therefore do not take the results of Sect. 2.2 into account. Nonetheless, the comparison in Fig. 4 is reasonable, as all the highly magnetized NSs displayed here were observed at luminosities of L ≲ 0.5 Lcrit (Sco X-1 is the exception, likely having a low magnetic field).
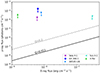 |
Fig. 4. 3σ upper limits of the γ-ray flux in the 2.2 MeV line (assuming FWHM = 10 keV) from the targets considered here, as a function of their X-ray luminosity. The solid and dashed lines show the line intensities expected from Eqs. (4) and (5). |
The X-ray fluxes in Fig. 4 were obtained in the 0.1–100 keV range using the best-fit models derived from the SPI spectra analysed here, the JEM-X and ISGRI spectra available from the Multi-Messenger Online Data Analysis (MMODA) product gallery7 (Neronov et al. 2021), and the spectral findings from previous studies that also analysed the data discussed in this work (refer to Sect. 4). As evident in Fig. 4, the upper limits we obtained are far from the predictions. The source whose upper limit of the 2.2 MeV line flux is closest to the theoretical predictions is Sco X-1. In this regard, we point out that a lowest upper limit for Sco X-1 exists, which was obtained with COMPTEL (F2.2 ≤ 2.5 × 10⁻⁵ ph cm−2 s−1; McConnell et al. 1997).
5.2. 511 keV line
In high magnetic field environments, γ rays (including those from the 2.2 MeV line) with energies above the pair production threshold of 2mec2 can generate e+e− pairs. When the e+e− pairs annihilate, they produce 511 keV photons, and the high-energy photon flux is reduced. Bildsten et al. (1992) suggested that the 511 keV line could be detectable in accreting pulsars with B ≳ 3 × 10¹² G. Since most of the NSs considered in this work have strong magnetic fields, with Sco X−1 being the only exception, this process could produce an observable 511 keV line feature. Therefore, we searched for this using the same method used for the redshifted 2.2 MeV line, but did not detect any. The 3σ upper limits are reported in Table 1. Figure 5 shows an example (A 0535+26) of one of these spectra.
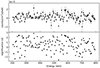 |
Fig. 5. SPI spectrum of A 0535+26, in the energy range 200−800 keV. Upper panel: Background-subtracted spectrum of A 0535+26. Lower panel: Significance of the residuals as a function of energy. Uncertainties in these panels do not include systematic errors. |
5.3. Future observations
We point out that the MeV bandpass is currently the least explored of the whole electromagnetic spectrum (a feature often referred to as the MeV gap). Future γ-ray spectrometers, such as the Compton Spectrometer and Imager (COSI; launch expected in 2027; Tomsick et al. 2023), the concept missions e-ASTROGAM (de Angelis et al. 2018), the MeV Astrophysical Spectroscopic Surveyor (MASS; Zhu et al. 2024), the MeV Gamma-Ray Observatory (MeVGRO)8, and the Focusing Imager of Nuclear Astrophysics (FIONA)9, are expected to reach line sensitivity close to the theoretical predictions by the model from Bildsten et al. (1993) for Sco X-1, assuming Q ≈ 0.01. In particular, COSI will achieve a 3σ line point source sensitivity in two years of survey observations of ∼3 × 10⁻⁶ ph cm−2 s−1 (Tomsick et al. 2023), while e-ASTROGAM could achieve a 3σ line point source sensitivity in 106 s of ∼2 × 10⁻⁶ ph cm−2 s−1 (see Table 1.3.3 in: de Angelis et al. 2018). Even if the emission line is not detected by these future instruments, the upper limits they provide could be useful in setting tighter constraints on various parameters of the theoretical models for the production of this line. For example, the upper limits obtained with COSI and e-ASTROGAM could set limits on Y and Q parameters in the model from Bildsten et al. (1993). This is shown in Fig. 6: the area subtended by the orange line shows the Y − Q parameter space allowed by the upper limit obtained with COMPTEL; similarly Fig. 6 shows the Y − Q parameter spaces allowed by the expected 3σ line source sensitivity by COSI and e-ASTROGAM. SPI data does not have enough sensitivity to constrain Q and Y.
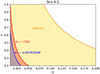 |
Fig. 6. Comparison of achievable constraints on the parameters Y and Q for Sco X-1 using Eq. (5), between the future γ-ray mission COSI, the mission concept e-ASTROGAM, and the current constraints obtainable with COMPTEL data. |
To obtain a significant detection of the 2.2 MeV line, a dramatic leap in the sensitivity of future MeV telescopes is needed. Based on the current state-of-the-art technology, achieving this could be possible by using, for example, flux concentrating telescopes. These would allow for smaller detector sizes and, as such, a lower level of instrumental background. A viable option involves the use of γ-ray optics that employ the so-called Laue lenses (Frontera & von Ballmoos 2010), which rely on Bragg diffraction from arrays of crystals and operate in the ∼MeV band (see Virgilli et al. 2022a for more on this technology and the even more advanced Fresnel lenses). Figure 6 in Virgilli et al. (2022b) shows a qualitative example of the gain in sensitivity (although in a slightly different energy band from the one of interest in this work) that could be achieved with an instrument using this type of optics. There are also lens designs proposals aimed at extending the energy range over which Laue lenses could operate while maintaining reasonably high sensitivity. These include tunable Laue lenses (Lund 2021a,b) and multiple layer Laue lenses (see Virgilli et al. 2022a, and references therein).
6. Conclusion
We have reported the results of searching for the redshifted line of 2.2 MeV in a representative sample of XRBs, comprising both highly and low magnetized NSs. Although we were unable to detect the line, the upper limits we obtained represent the strongest constraint ever achieved using SPI data. From a theoretical point of view, we have shown that for highly magnetized NSs, there is an optimal X-ray luminosity to maximize the chances of detecting the 2.2 MeV line. It should be about half the critical luminosity; for a typical XRP this is around ∼5 × 1036 erg s−1.
The upper limits obtained are higher than the expected line intensity, indicating that a significant increase in sensitivity from future MeV missions is necessary.
Finally, we note that for this study we selected a representative, though not exhaustive, sample of XRBs observed by SPI. Therefore, the search for the redshifted 2.2 MeV line could be extended in the future to include other XRBs, exploring various luminosity states and thus fully leveraging the INTEGRAL/SPI data archive.
The anisotropy of X-ray and γ-ray emission from the NS surface causes a difference between the isotropic and observed phase-averaged flux, but the difference is expected to be within a factor of two (see e.g. Markozov & Mushtukov 2024).
spidai is available at https://sigma2.irap.omp.eu/integral/spidai by requesting a personal account.
XSPEC version 12.13.1d (Arnaud 1996).
Acknowledgments
We thank the anonymous referee for constructive comments that helped improve the paper. L.D. acknowledges Elisabeth Jourdain and Jean-Pierre Roques for their help on the use of spidai. ST acknowledges support from the Alexander von Humboldt Foundation through the Friedrich Wilhelm Bessel Research Award and is grateful to the Institute for Astronomy and Astrophysics at the University of Tübingen for their hospitality. A.M. acknowledges UKRI Stephen Hawking fellowship. This paper is based on data from observations with INTEGRAL, an ESA project with instruments and science data centre funded by ESA member states (especially the PI countries: Denmark, France, Germany, Italy, Spain, and Switzerland), Czech Republic and Poland, and with the participation of Russia and the USA.
References
- Aharonian, F. A., & Sunyaev, R. A. 1984, MNRAS, 210, 257 [NASA ADS] [CrossRef] [Google Scholar]
- Arnaud, K. A. 1996, ASP Conf. Ser., 101, 17 [Google Scholar]
- Bailer-Jones, C. A. L., Rybizki, J., Fouesneau, M., Demleitner, M., & Andrae, R. 2021, AJ, 161, 147 [Google Scholar]
- Basko, M. M., & Sunyaev, R. A. 1976, MNRAS, 175, 395 [Google Scholar]
- Becker, P. A., Klochkov, D., Schönherr, G., et al. 2012, A&A, 544, A123 [NASA ADS] [CrossRef] [EDP Sciences] [Google Scholar]
- Bildsten, L., Salpeter, E. E., & Wasserman, I. 1992, ApJ, 384, 143 [NASA ADS] [CrossRef] [Google Scholar]
- Bildsten, L., Salpeter, E. E., & Wasserman, I. 1993, ApJ, 408, 615 [NASA ADS] [CrossRef] [Google Scholar]
- Boggs, S. E., & Smith, D. M. 2006, ApJ, 637, L121 [NASA ADS] [CrossRef] [Google Scholar]
- Brecher, K., & Burrows, A. 1980, ApJ, 240, 642 [NASA ADS] [CrossRef] [Google Scholar]
- Çalişkan, Ş., Kalemci, E., Baring, M. G., Boggs, S. E., & Kretschmar, P. 2009, ApJ, 694, 593 [CrossRef] [Google Scholar]
- Daugherty, J. K., & Harding, A. K. 1986, ApJ, 309, 362 [NASA ADS] [CrossRef] [Google Scholar]
- de Angelis, A., Tatischeff, V., Grenier, I. A., et al. 2018, J. High Energy Astrophys., 19, 1 [NASA ADS] [CrossRef] [Google Scholar]
- Diehl, R., Siegert, T., Greiner, J., et al. 2018, A&A, 611, A12 [NASA ADS] [CrossRef] [EDP Sciences] [Google Scholar]
- Falanga, M., Bozzo, E., Lutovinov, A., et al. 2015, A&A, 577, A130 [NASA ADS] [CrossRef] [EDP Sciences] [Google Scholar]
- Ferrigno, C., Ducci, L., Bozzo, E., et al. 2016, A&A, 595, A17 [NASA ADS] [CrossRef] [EDP Sciences] [Google Scholar]
- Frontera, F., & von Ballmoos, P. 2010, X-Ray Optics and Instrumentation 2010, 2010, 215375 [Google Scholar]
- Galaudage, S., Wette, K., Galloway, D. K., & Messenger, C. 2022, MNRAS, 509, 1745 [Google Scholar]
- Guessoum, N., & Jean, P. 2002, A&A, 396, 157 [NASA ADS] [CrossRef] [EDP Sciences] [Google Scholar]
- Guessoum, N., & Jean, P. 2004, Nucl. Phys. B Proc. Suppl., 132, 396 [NASA ADS] [CrossRef] [Google Scholar]
- Harris, M. J., & Share, G. H. 1991, ApJ, 381, 439 [CrossRef] [Google Scholar]
- Jean, P., & Guessoum, N. 2001, A&A, 378, 509 [NASA ADS] [CrossRef] [EDP Sciences] [Google Scholar]
- Jourdain, E., & Roques, J. P. 2009, ApJ, 704, 17 [Google Scholar]
- Klochkov, D., Doroshenko, V., Santangelo, A., et al. 2012, A&A, 542, L28 [NASA ADS] [CrossRef] [EDP Sciences] [Google Scholar]
- Lund, N. 2021a, Exp. Astron., 51, 165 [NASA ADS] [CrossRef] [Google Scholar]
- Lund, N. 2021b, Exp. Astron., 51, 153 [NASA ADS] [CrossRef] [Google Scholar]
- Malacaria, C., Klochkov, D., Santangelo, A., & Staubert, R. 2015, A&A, 581, A121 [NASA ADS] [CrossRef] [EDP Sciences] [Google Scholar]
- Markozov, I. D., & Mushtukov, A. A. 2024, MNRAS, 527, 5374 [Google Scholar]
- Markozov, I. D., Kaminker, A. D., & Potekhin, A. Y. 2023, Astron. Lett., 49, 583 [CrossRef] [Google Scholar]
- McConnell, M., Fletcher, S., Bennett, K., et al. 1997, AIP Conf. Ser., 410, 1099 [NASA ADS] [CrossRef] [Google Scholar]
- Mighell, K. J. 1999, ApJ, 518, 380 [Google Scholar]
- Mushtukov, A., & Tsygankov, S. 2022, arXiv e-prints [arXiv:2204.14185] [Google Scholar]
- Mushtukov, A. A., Suleimanov, V. F., Tsygankov, S. S., & Poutanen, J. 2015a, MNRAS, 447, 1847 [NASA ADS] [CrossRef] [Google Scholar]
- Mushtukov, A. A., Tsygankov, S. S., Serber, A. V., Suleimanov, V. F., & Poutanen, J. 2015b, MNRAS, 454, 2714 [Google Scholar]
- Neronov, A., Savchenko, V., Tramacere, A., et al. 2021, A&A, 651, A97 [NASA ADS] [CrossRef] [EDP Sciences] [Google Scholar]
- Özel, F., & Psaltis, D. 2003, ApJ, 582, L31 [CrossRef] [Google Scholar]
- Reig, P., & Roche, P. 1999, MNRAS, 306, 100 [NASA ADS] [CrossRef] [Google Scholar]
- Reina, C., Treves, A., & Tarenghi, M. 1974, A&A, 32, 317 [NASA ADS] [Google Scholar]
- Roques, J.-P., & Jourdain, E. 2019, ApJ, 870, 92 [NASA ADS] [CrossRef] [Google Scholar]
- Roques, J. P., Schanne, S., von Kienlin, A., et al. 2003, A&A, 411, L91 [NASA ADS] [CrossRef] [EDP Sciences] [Google Scholar]
- Rosenberg, F. D., Eyles, C. J., Skinner, G. K., & Willmore, A. P. 1975, Nature, 256, 628 [NASA ADS] [CrossRef] [Google Scholar]
- Salganik, A., Tsygankov, S. S., Doroshenko, V., et al. 2023, MNRAS, 524, 5213 [NASA ADS] [CrossRef] [Google Scholar]
- Sartore, N., Jourdain, E., & Roques, J. P. 2015, ApJ, 806, 193 [NASA ADS] [CrossRef] [Google Scholar]
- Shvartsman, V. F. 1970, Astrophysics, 6, 56 [Google Scholar]
- Siemiginowska, A. 2011, in Statistics, eds. K. Arnaud, R. Smith, & A. Siemiginowska (Cambridge University Press), Cambridge Observing Handbooks for Research Astronomers, 131 [Google Scholar]
- Teegarden, B. J., & Watanabe, K. 2006, ApJ, 646, 965 [NASA ADS] [CrossRef] [Google Scholar]
- Tomsick, J. A., Boggs, S. E., Zoglauer, A., et al. 2023, arXiv e-prints [arXiv:2308.12362] [Google Scholar]
- Vedrenne, G., Roques, J. P., Schönfelder, V., et al. 2003, A&A, 411, L63 [NASA ADS] [CrossRef] [EDP Sciences] [Google Scholar]
- Vestrand, W. 1989, in Proceedings of the Gamma-Ray Observatory Workshop, ed. N. Johnson, 4 [Google Scholar]
- Virgilli, E., Halloin, H., & Skinner, G. 2022a, in Laue and Fresnel Lenses, eds. C. Bambi, & A. Santangelo (Singapore: Springer Nature Singapore), 1 [Google Scholar]
- Virgilli, E., Frontera, F., Rosati, P., et al. 2022b, arXiv e-prints [arXiv:2211.16916] [Google Scholar]
- Vrtilek, S. D., Penninx, W., Raymond, J. C., et al. 1991, ApJ, 376, 278 [CrossRef] [Google Scholar]
- White, N. E., Mason, K. O., Sanford, P. W., & Murdin, P. 1976, MNRAS, 176, 201 [NASA ADS] [Google Scholar]
- Zhu, J., Zheng, X., Feng, H., et al. 2024, Exp. Astron., 57, 2 [NASA ADS] [CrossRef] [Google Scholar]
Appendix A: SPI upper limits in highly magnetized neutron stars during outbursts
In Sect. 3 we selected the SPI data to search for the redshifted 2.2 MeV line based on the theoretical results presented in Sect. 2.2. Specifically, we focused on observations of highly magnetized NSs with luminosities ≲0.5Lcrit. One might question whether this emission line could be detected in these sources at higher luminosity states, regardless of the theoretical evidence discussed in Sect. 2.2. Although we consider this hypothesis unlikely, for the sake of completeness, we present in this appendix the upper limits obtained from the search for the redshifted 2.2 MeV line in A 0535+26, GX 304−1, RX J0440.9+4431, and Swift J0243.6+6124 during bright outbursts detected with SPI. These observations are summarized in Table A.1.
Time intervals of the observations analysed in this work.
For A 0535+26, we considered the giant outburst that occurred in 2011 (Sartore et al. 2015). For V 0332+53, we considered both giant outbursts observed by INTEGRAL in 2004-2005 and in 2015 (Ferrigno et al. 2016). For GX 304−1, we considered the bright outburst of 2012 (Klochkov et al. 2012; Malacaria et al. 2015). For RX J0440.9+4431, we considered the outburst observed by INTEGRAL in 2023 (Salganik et al. 2023). For Swift J0243.6+6124, we considered the outburst observed by INTEGRAL in 2023.
Table A.1 shows, for each source, the net exposure time and the 3σ upper limits on the redshifted 2.2 MeV and 511 keV lines.
Appendix B: 200-800 keV and 1-2.2 MeV upper limits
Table B.1 shows the 3σ upper limits of the fluxes in the energy bands 200-800 keV and 1-2.2 MeV. For these calculations, we extracted the spectra in the energy range of 20-2200 keV adopting broader energy bins than those used in Sect. 3, 15 bins in log-scale. We then fitted the spectra above 200 keV with a power law using the spectral model pegpwrlw in xspec.
Highly magnetized accreting NSs during bright X-ray luminosity states, along with their respective net exposure times for the SPI data, and the highest 3σ upper limits in the ranges 1−2.2 MeV (for a redshifted 2.2 MeV line) and 200-800 keV (for a 511 keV line), assuming different values of FWHM.
Accreting NSs analysed in this work, along with their respective 3σ upper limits in the energy bands 200-800 keV and 1−2.2 MeV.
All Tables
Accreting NSs analysed in this study, along with their respective net exposure times for the SPI data, and the highest 3σ upper limits in the ranges 1−2.2 MeV (for a redshifted 2.2 MeV line) and 200–800 keV (for a 511 keV line), assuming different values of FWHM.
Highly magnetized accreting NSs during bright X-ray luminosity states, along with their respective net exposure times for the SPI data, and the highest 3σ upper limits in the ranges 1−2.2 MeV (for a redshifted 2.2 MeV line) and 200-800 keV (for a 511 keV line), assuming different values of FWHM.
Accreting NSs analysed in this work, along with their respective 3σ upper limits in the energy bands 200-800 keV and 1−2.2 MeV.
All Figures
|
Fig. 1. Expected luminosity of the 2.2 MeV line, L2.2 MeV, as a function of the total accretion luminosity L of an XRP. Both axes are scaled by the critical accretion luminosity Lcrit. At low mass accretion rates and luminosity, the flux in the 2.2 MeV line is proportional to the total accretion luminosity. At high mass accretion rates, however, the radiative force decelerates the accretion flow above the NS surface, which results in a sharp drop in luminosity in the 2.2 MeV line. |
| In the text | |
|
Fig. 2. SPI spectrum of A 0535+26, in the energy range 1–2.2 MeV. Upper panel: Background-subtracted spectrum of A 0535+26. Lower panel: Significance of the residuals as a function of energy. Uncertainties in these panels do not include systematic errors. |
| In the text | |
|
Fig. 3. Green histogram: Distribution of the rate of the spectrum of A 0535+26 (1–2.2 MeV). Black line: Best fit with a Gaussian function. |
| In the text | |
|
Fig. 4. 3σ upper limits of the γ-ray flux in the 2.2 MeV line (assuming FWHM = 10 keV) from the targets considered here, as a function of their X-ray luminosity. The solid and dashed lines show the line intensities expected from Eqs. (4) and (5). |
| In the text | |
|
Fig. 5. SPI spectrum of A 0535+26, in the energy range 200−800 keV. Upper panel: Background-subtracted spectrum of A 0535+26. Lower panel: Significance of the residuals as a function of energy. Uncertainties in these panels do not include systematic errors. |
| In the text | |
|
Fig. 6. Comparison of achievable constraints on the parameters Y and Q for Sco X-1 using Eq. (5), between the future γ-ray mission COSI, the mission concept e-ASTROGAM, and the current constraints obtainable with COMPTEL data. |
| In the text | |
Current usage metrics show cumulative count of Article Views (full-text article views including HTML views, PDF and ePub downloads, according to the available data) and Abstracts Views on Vision4Press platform.
Data correspond to usage on the plateform after 2015. The current usage metrics is available 48-96 hours after online publication and is updated daily on week days.
Initial download of the metrics may take a while.