Fig. 8
Download original image
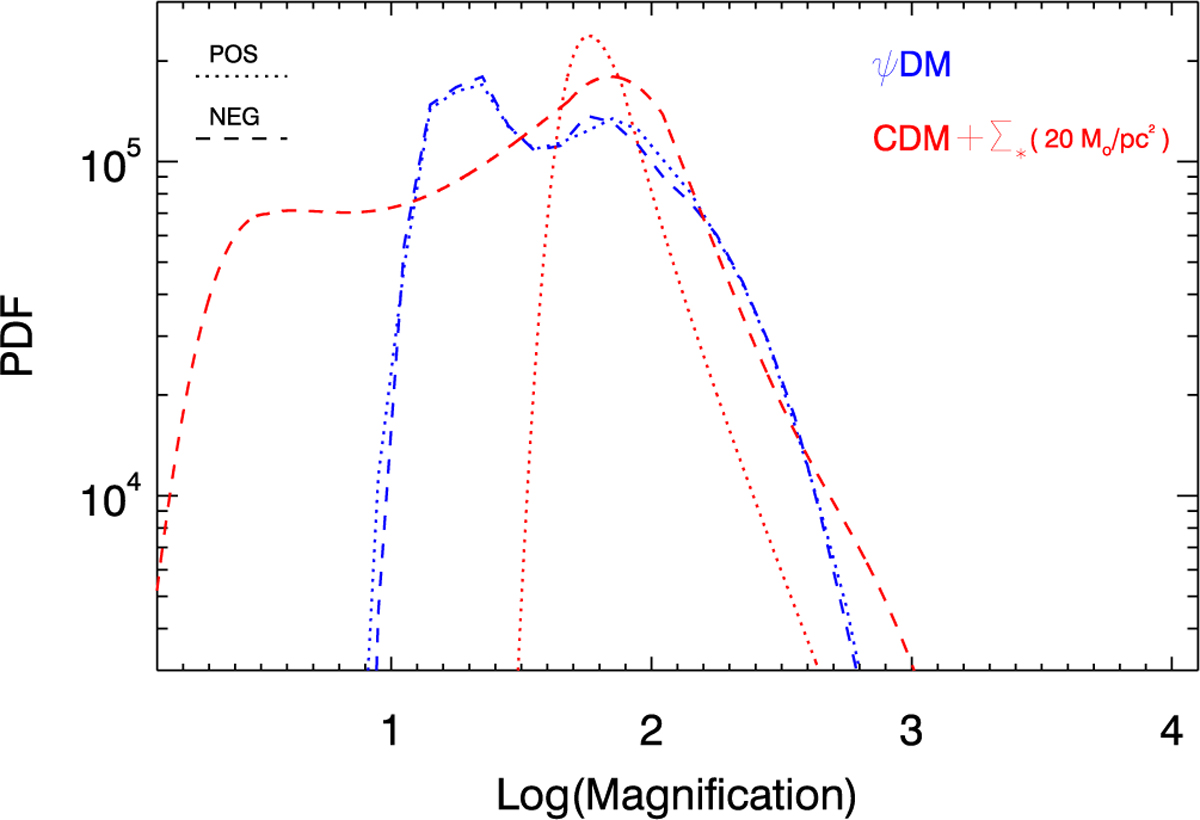
Comparison of magnification with ψDM and CDM+microlenses. Dotted lines represent regions having positive parity while dashed lines are for negative parity. In all curves, the macromodel magnification is set to 80. In the case of CDM (red curves), the substructure is created by microlenses with surface mass density 20 M⊙ pc−2. The addition of microlenses to ψDM would slightly broaden the dashed-line curves, but maintaining the demagnification peak (that is, at μ < 80) on the side with positive parity.
Current usage metrics show cumulative count of Article Views (full-text article views including HTML views, PDF and ePub downloads, according to the available data) and Abstracts Views on Vision4Press platform.
Data correspond to usage on the plateform after 2015. The current usage metrics is available 48-96 hours after online publication and is updated daily on week days.
Initial download of the metrics may take a while.