Fig. 7
Download original image
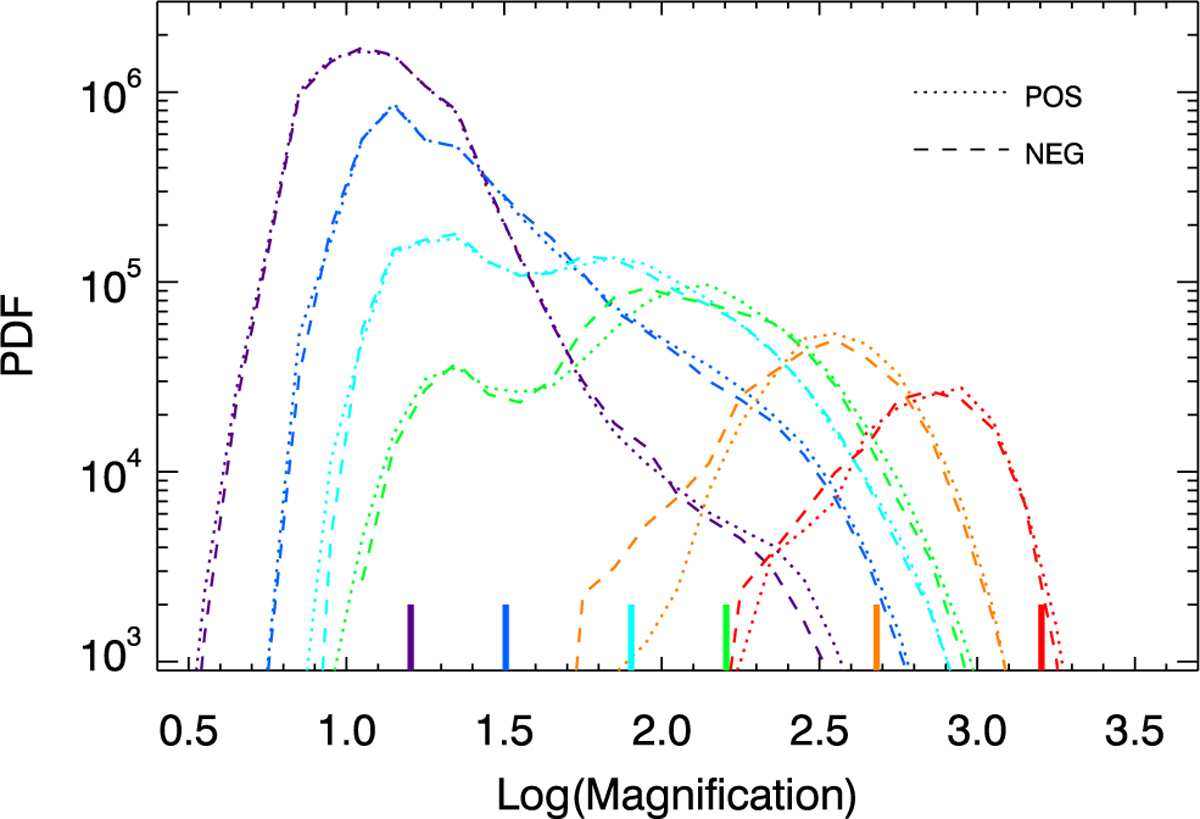
Probability of magnification for ψDM in the source plane. The probability is derived from the regions shown in Fig. 6. Each color corresponds to a different macromodel magnification, indicated by the thick vertical solid lines. The dotted and dashed lines correspond to the positive and negative macromodel magnifications, respectively.
Current usage metrics show cumulative count of Article Views (full-text article views including HTML views, PDF and ePub downloads, according to the available data) and Abstracts Views on Vision4Press platform.
Data correspond to usage on the plateform after 2015. The current usage metrics is available 48-96 hours after online publication and is updated daily on week days.
Initial download of the metrics may take a while.