Fig. 6
Download original image
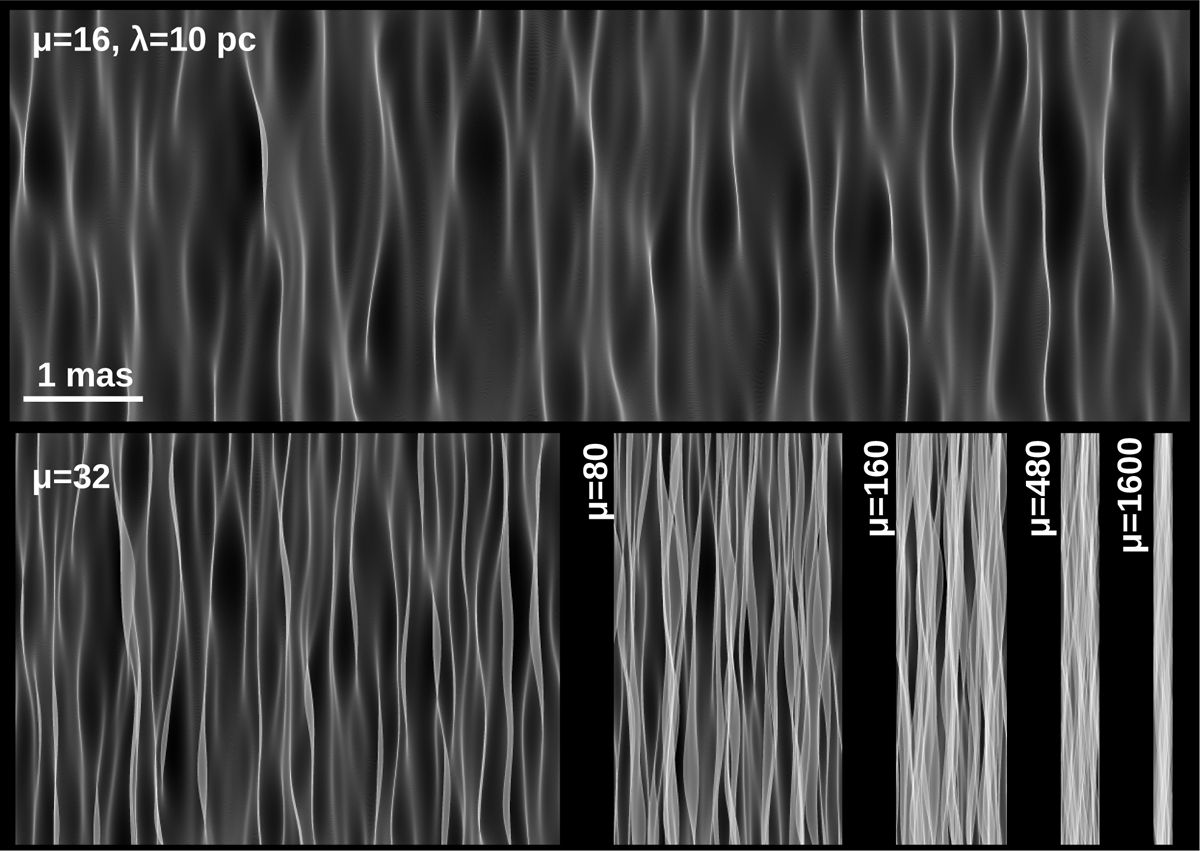
Caustics for ψDM. The top panel shows the caustics (magnification in gray scale) formed by ψDM with λ = 10 pc in a region with macromodel magnification μ = 10 × 1.6 = 16 and positive parity, that is, 80 × 31.2 pc2 in the source plane. The bottom panel displays the same realization of ψDM but with increasing values of the tangential macromodel magnification (and hence, smaller areas in the source plane) while the radial component is maintained at μr = 1.6. The cluster caustic is not shown but would be a thin vertical line to the right of the bottom-right panel. The scale is the same in all plots. The caustics with the same macromodel magnification but negative parity look almost indistinguishable. The corresponding distributions of magnification values are shown in Fig. 7.
Current usage metrics show cumulative count of Article Views (full-text article views including HTML views, PDF and ePub downloads, according to the available data) and Abstracts Views on Vision4Press platform.
Data correspond to usage on the plateform after 2015. The current usage metrics is available 48-96 hours after online publication and is updated daily on week days.
Initial download of the metrics may take a while.