Fig. 4
Download original image
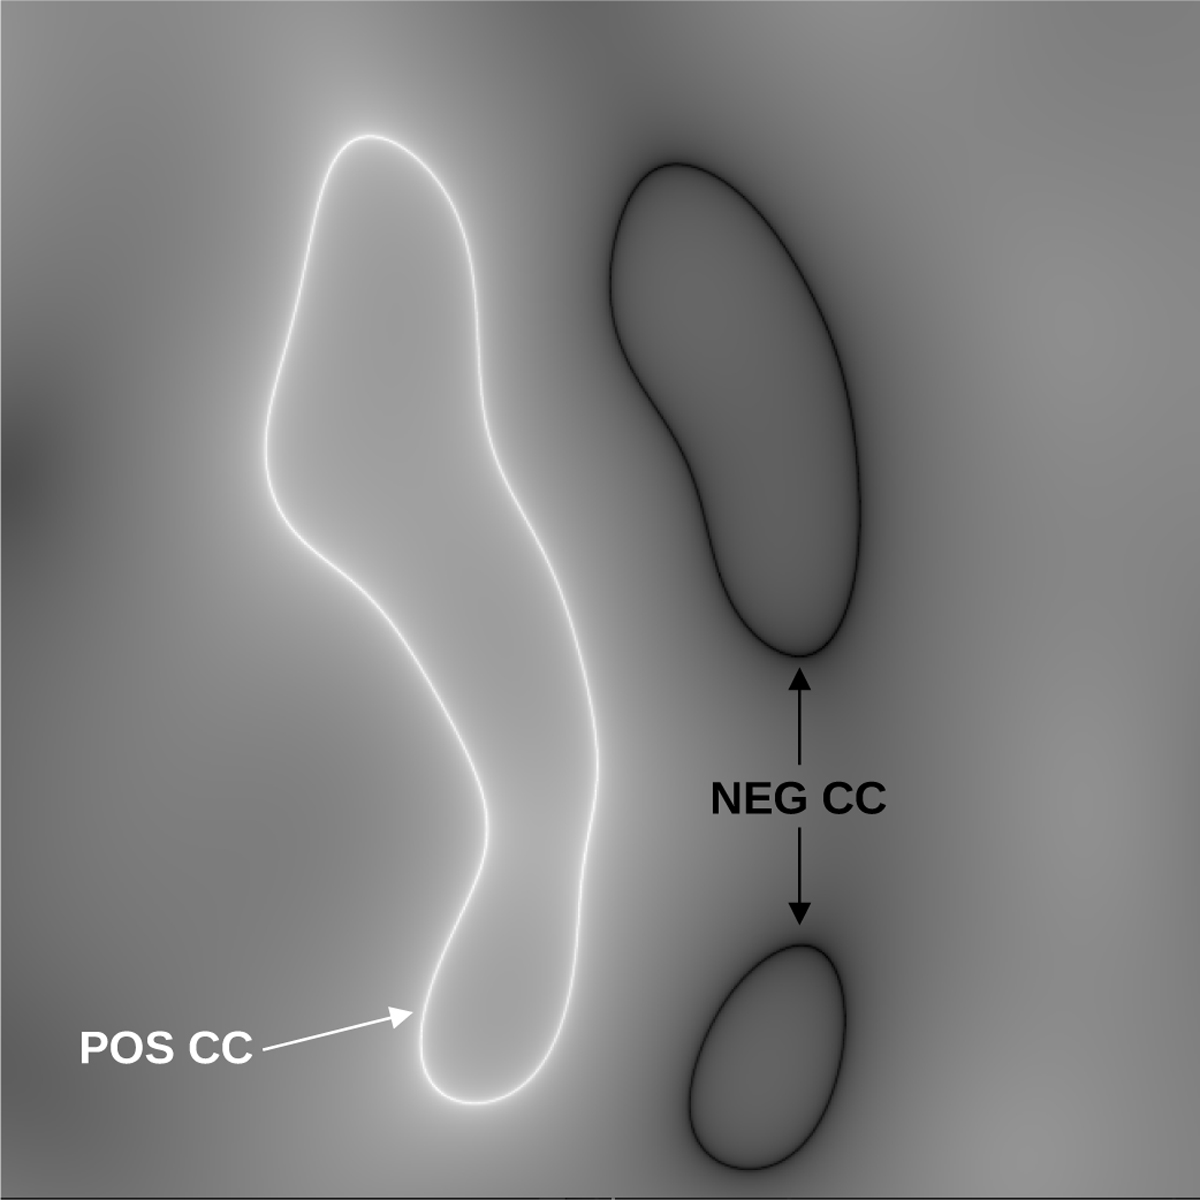
Dependence of CCs on parity. The image shows the sum of the logarithm of magnifications (gray scale), log(μ+) − log(μ−), from the same ψDM perturbation but for the two parities, μ+ and μ−. For this particular case, the ψDM perturbation contained both positive and negative fluctuations in mass and corresponds to the yellow square region in the top panel of Fig. 3. The white line represents the ψDM CC when the ψDM perturbation is on the side with positive parity (as in Fig. 3). The black line represents the ψDM CC when the same ψDM perturbation is on the side with negative parity.
Current usage metrics show cumulative count of Article Views (full-text article views including HTML views, PDF and ePub downloads, according to the available data) and Abstracts Views on Vision4Press platform.
Data correspond to usage on the plateform after 2015. The current usage metrics is available 48-96 hours after online publication and is updated daily on week days.
Initial download of the metrics may take a while.