Fig. 3
Download original image
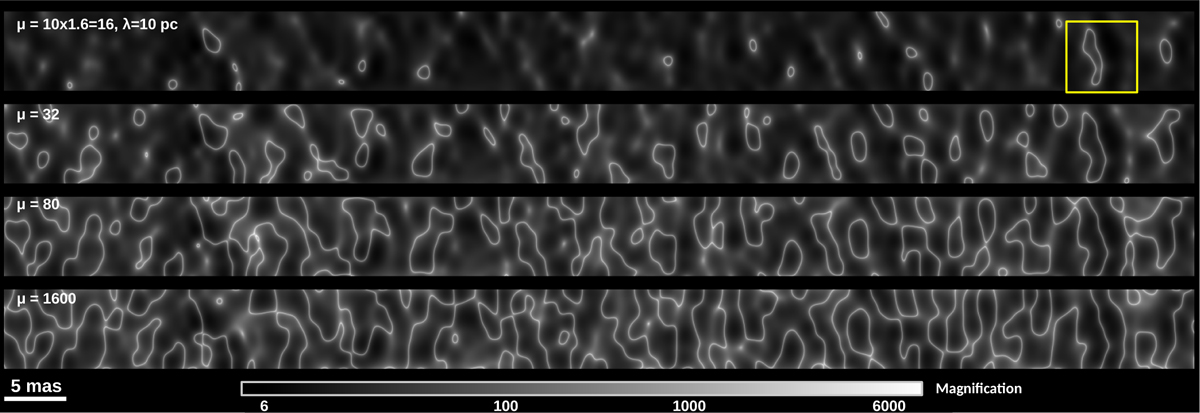
Magnification in the image plane for a ψDM model with a de Broglie wavelength of 10 pc and in regions with positive parity. The top panel shows the ψDM CC (magnification in gray scale) formed by ψDM with λ = 10 pc in a region with macromodel magnification μ = 10 × 1.6 = 16 and positive parity. The bottom panels show the same realization of ψDM but for increasing values of the tangential macromodel magnification (in the horizontal direction) or, similarly, for smaller distances to the macromodel CC, while the radial component (vertical direction) is maintained at μr = 1.6. The macromodel magnification, μ, typically scales with the distance, d, to the macromodel CC as μ ∝ 1/d. In this configuration, and in the absence of ψDM fluctuations or small-scale perturbations in the deflection field, the cluster CC would appear as a single vertical line when d = 0 or μt = ∝. The scale is the same in all plots. The corresponding distribution of magnification values is shown in Fig. 5. The yellow square in the top panel indicates the region shown in Fig. 4.
Current usage metrics show cumulative count of Article Views (full-text article views including HTML views, PDF and ePub downloads, according to the available data) and Abstracts Views on Vision4Press platform.
Data correspond to usage on the plateform after 2015. The current usage metrics is available 48-96 hours after online publication and is updated daily on week days.
Initial download of the metrics may take a while.