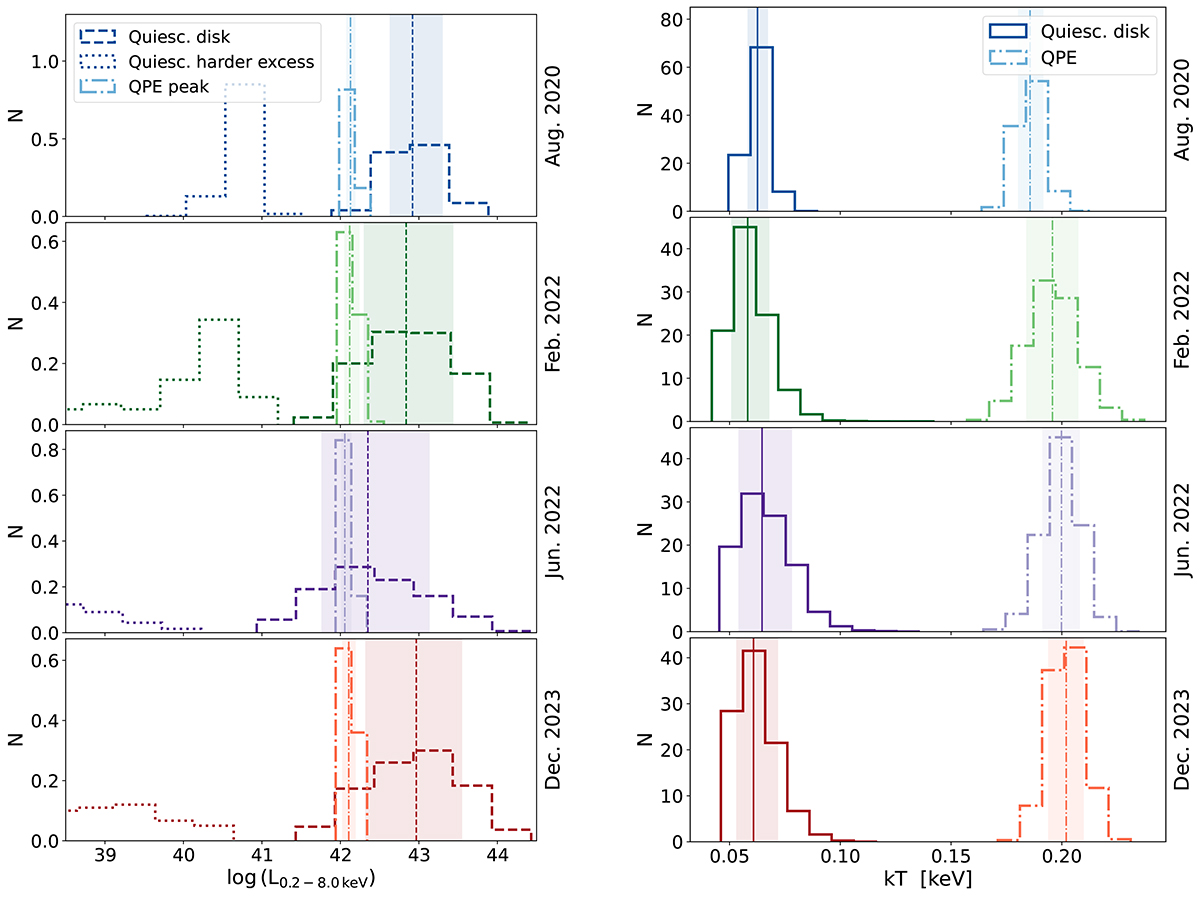
Fig. 4.
Download original image
Spectral evolution of QPEs. Darker to lighter colors represent the evolution from the start to end of the eruptions, color-coded as in the legend as a function of the epoch. The top right (medium right) panel shows the QPE bolometric luminosity (temperature) evolution with respect to the eruptions phase. The top left panel shows their coevolution. The bottom right panel shows the evolution of the emitting radius, assuming a thermal spectrum and spherical geometry.
Current usage metrics show cumulative count of Article Views (full-text article views including HTML views, PDF and ePub downloads, according to the available data) and Abstracts Views on Vision4Press platform.
Data correspond to usage on the plateform after 2015. The current usage metrics is available 48-96 hours after online publication and is updated daily on week days.
Initial download of the metrics may take a while.