Fig. 1.

Download original image
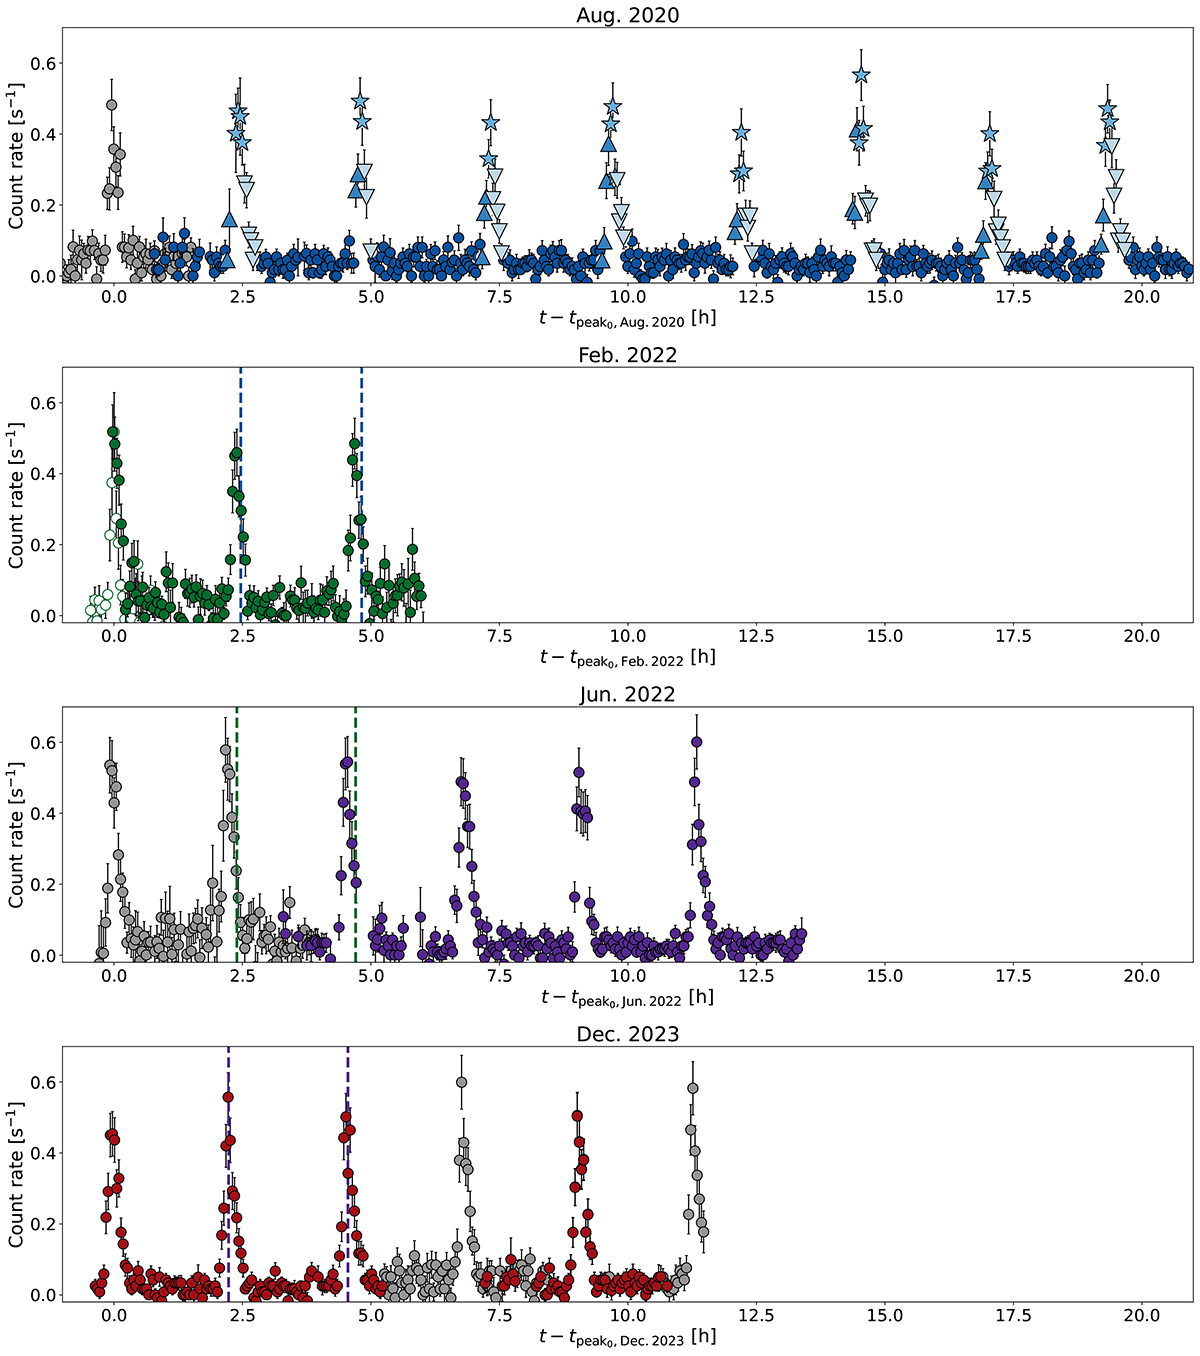
XMM-Newton 0.2–2.0 keV light curves of the four epochs, scaled by the arrival time of the first eruption in each observation. Time intervals contaminated by the flaring background are shown in grey. In the top panel, we additionally show the rise, peak, and decay phases selected for August 2020, as an example. In the second panel from the top, the first eruption is only partially resolved in EPIC-pn data and renormalized MOS1 data are shown with empty symbols. As the x-axis range is shared, we note the shortening of recurrence times over the ∼3.3 yr baseline, with vertical dashed lines showing the average arrival time interval of the previous epoch to guide the eye.
Current usage metrics show cumulative count of Article Views (full-text article views including HTML views, PDF and ePub downloads, according to the available data) and Abstracts Views on Vision4Press platform.
Data correspond to usage on the plateform after 2015. The current usage metrics is available 48-96 hours after online publication and is updated daily on week days.
Initial download of the metrics may take a while.


