Open Access
Fig. 7.
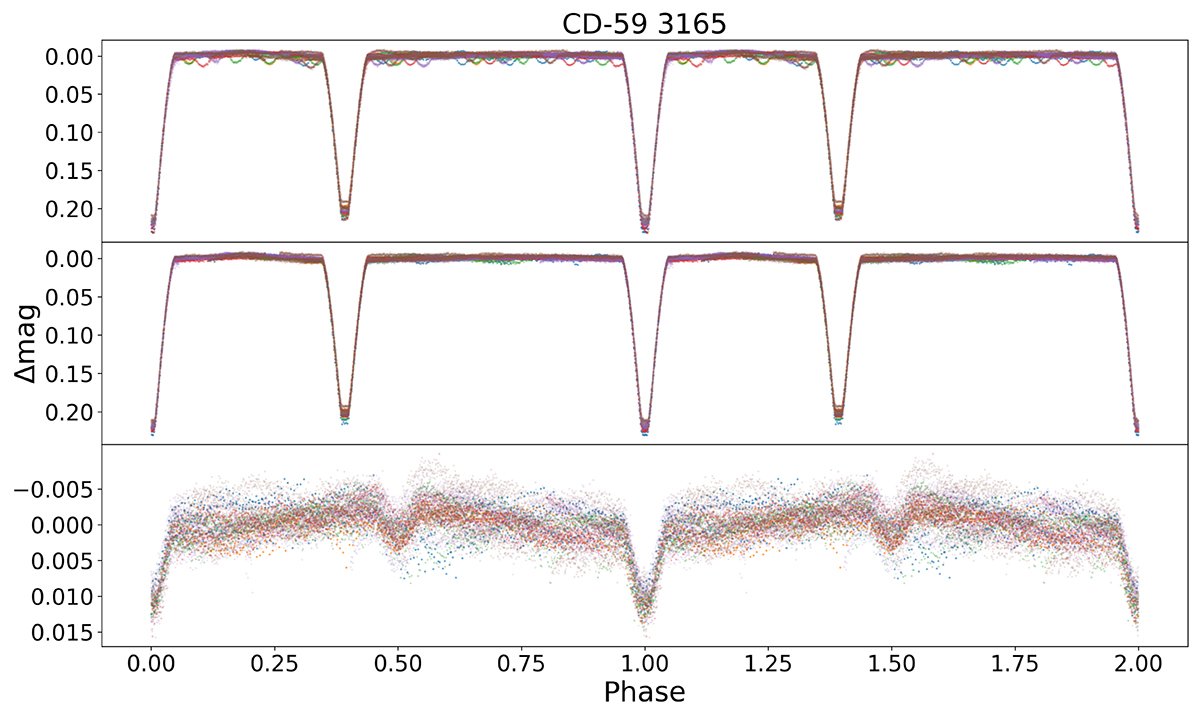
Download original image
Light curves of CD-59 3165. The top panel displays the composite LC. The middle panel illustrates the LC for the system with a period of 7.59 days, while the bottom pannel shows the system with a period of 3.18 days. Each color represents a different sector of TESS.
Current usage metrics show cumulative count of Article Views (full-text article views including HTML views, PDF and ePub downloads, according to the available data) and Abstracts Views on Vision4Press platform.
Data correspond to usage on the plateform after 2015. The current usage metrics is available 48-96 hours after online publication and is updated daily on week days.
Initial download of the metrics may take a while.