Fig. 10.

Download original image
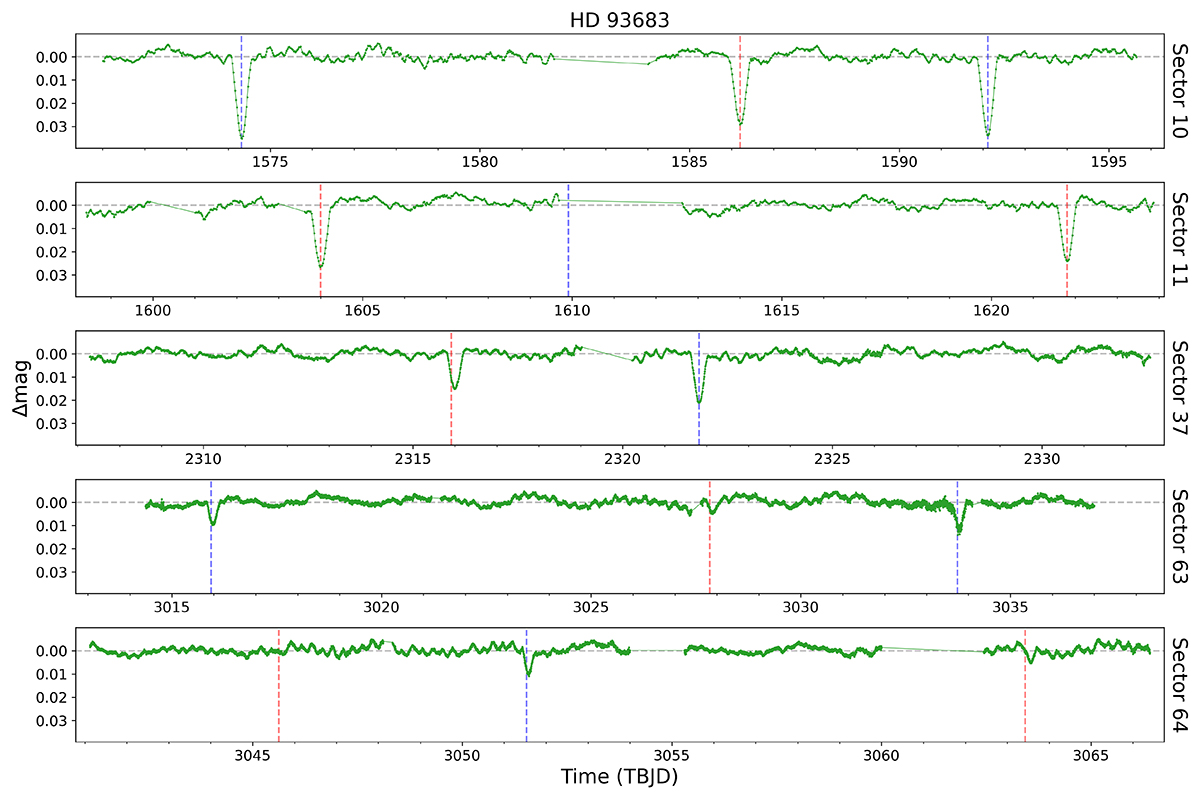
Light curves of HD 93683. Each panel represents a different TESS sector, arranged chronologically from top to bottom. Predicted timings for the primary and secondary eclipses are marked with blue and red dashed vertical lines, respectively. All panels maintain equal Y and X axis scales. Over 1500 days, both primary and secondary eclipses consistently decrease in depth from approximately 0.3Δmag to around 0.1Δmag, with the secondary eclipses being shallower overall. By the latest sector (64), the depth of the eclipses approaches the level of the system’s intrinsic variability, rendering the first secondary eclipse undetectable. Apsidal motion is evident as early as Sector 37 when compared to Sector 10, although data from later sectors are not reliable for further apsidal motion analysis.
Current usage metrics show cumulative count of Article Views (full-text article views including HTML views, PDF and ePub downloads, according to the available data) and Abstracts Views on Vision4Press platform.
Data correspond to usage on the plateform after 2015. The current usage metrics is available 48-96 hours after online publication and is updated daily on week days.
Initial download of the metrics may take a while.


