Fig. 3.
Download original image
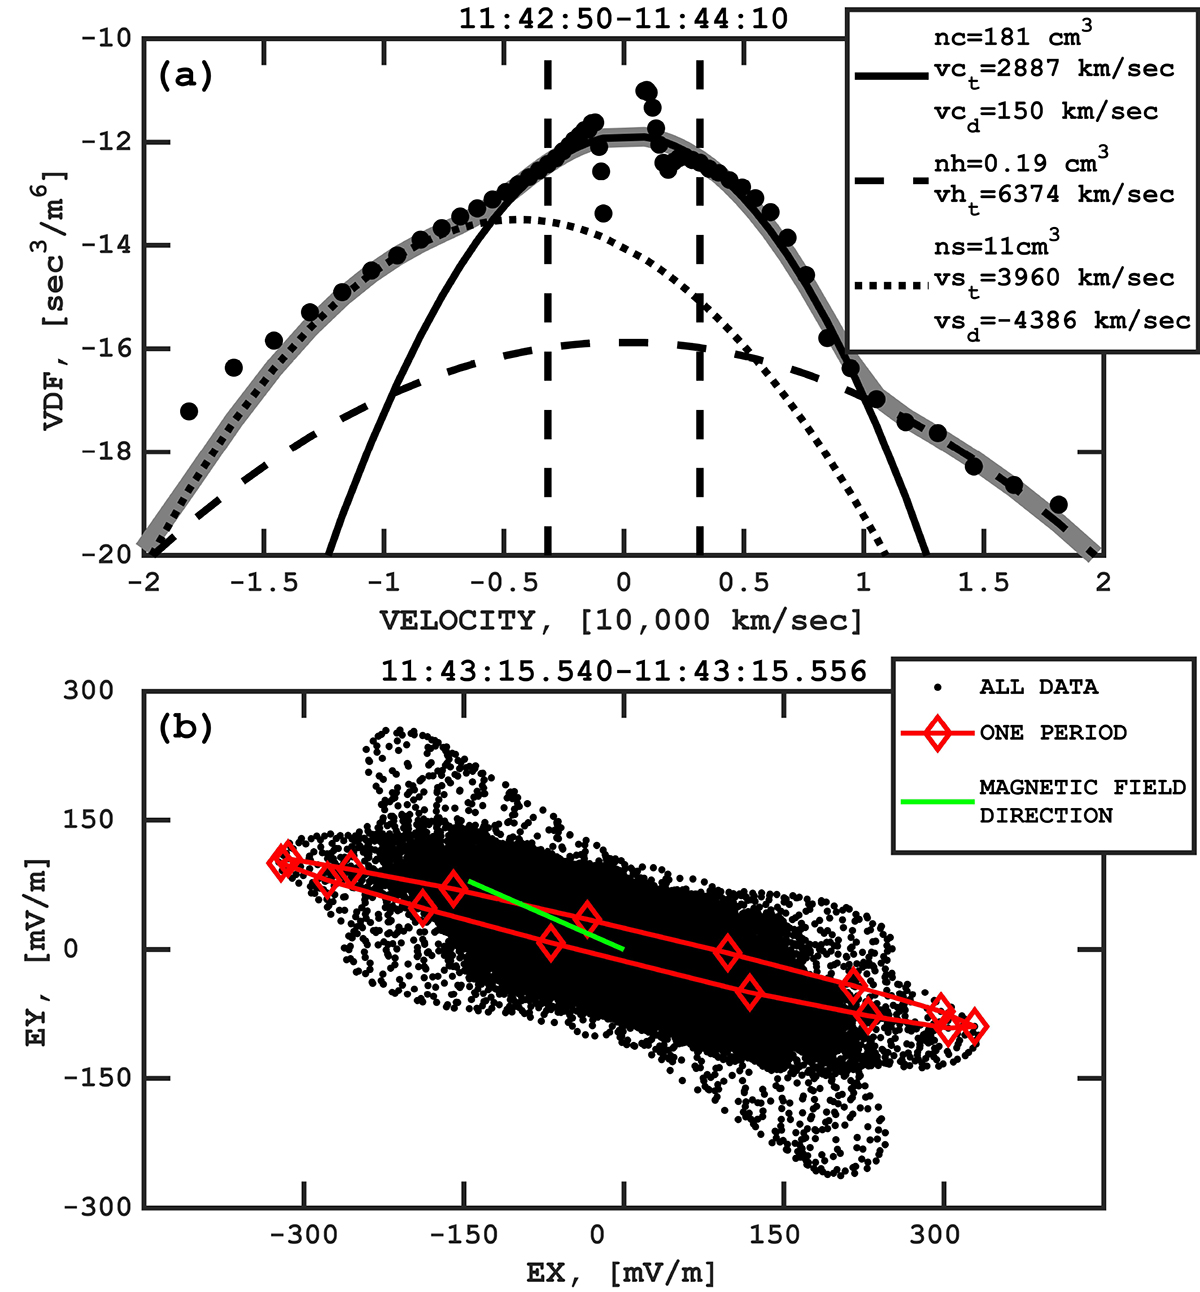
Electron and field properties during the type III event. Panel a gives the electron velocity distribution function during an 80-second interval surrounding the 15-millisecond-long Langmuir wave. It describes the core, halo, and strahl distributions, which show that the average core electron density and thermal velocity were 181 cm−3 and 2887 km/s. Panel b gives the hodogram of the electric field during this event. The hodogram is in the X − Y plane, but because BZ ≈ 0, it describes the relation between the electric field and the magnetic field direction, which is the green line. The electric field is generally parallel to the magnetic field, with significant deviations that are described in Figure 2d. The red curve in Figure 3b represents one period of the wave at the time of the data in Figure 6.
Current usage metrics show cumulative count of Article Views (full-text article views including HTML views, PDF and ePub downloads, according to the available data) and Abstracts Views on Vision4Press platform.
Data correspond to usage on the plateform after 2015. The current usage metrics is available 48-96 hours after online publication and is updated daily on week days.
Initial download of the metrics may take a while.