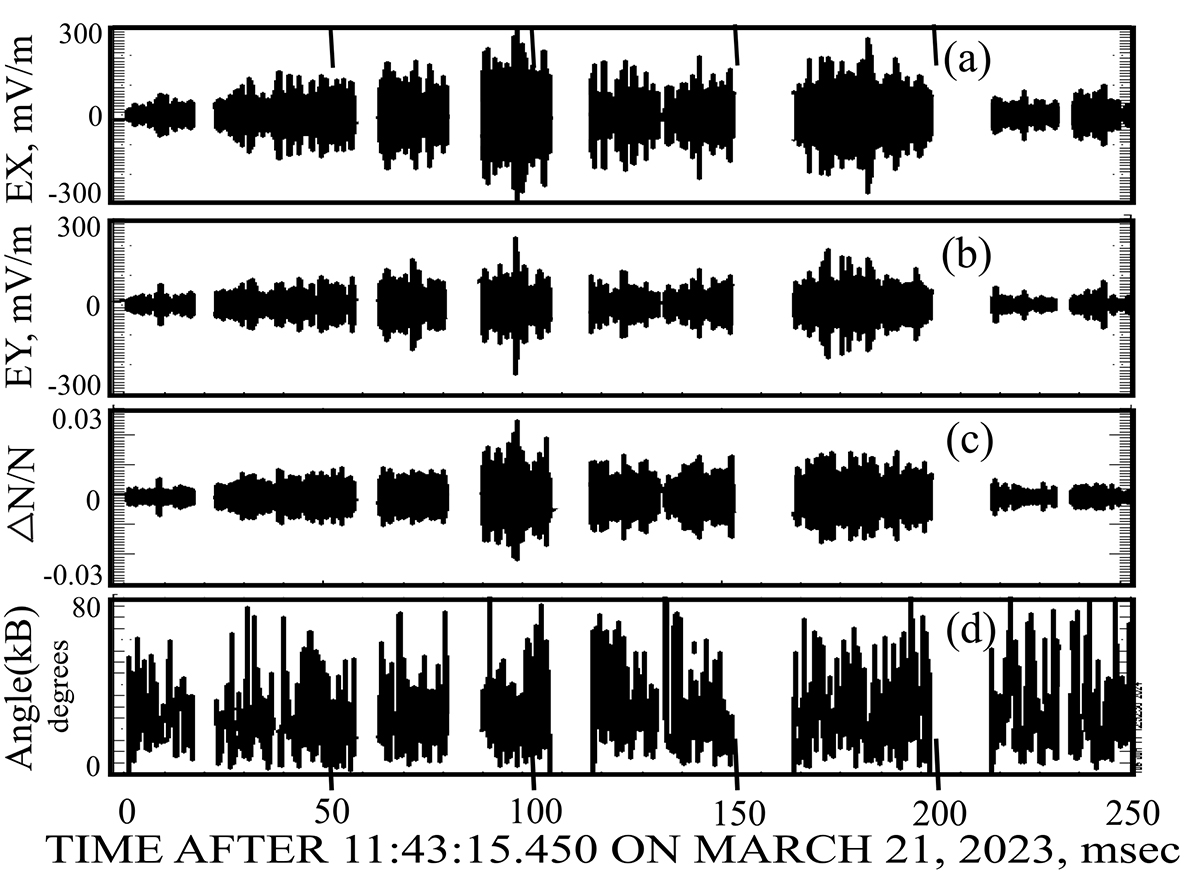
Fig. 2.
Download original image
Eleven short bursts of data obtained during a 250 msec interval during the type III emission. Panels a and b give the X and Y components of the electric field in the spacecraft frame. Panel c gives the density fluctuations that are expected to accompany Langmuir waves. Panel d presents the angle in the X − Y plane between the background magnetic field and the electric field wave vector. The largest event, near 11:43:15.460, is discussed in the main text, and the small and medium size events near 11:43:15.450 and 11:43:15.580 are discussed in the appendix.
Current usage metrics show cumulative count of Article Views (full-text article views including HTML views, PDF and ePub downloads, according to the available data) and Abstracts Views on Vision4Press platform.
Data correspond to usage on the plateform after 2015. The current usage metrics is available 48-96 hours after online publication and is updated daily on week days.
Initial download of the metrics may take a while.