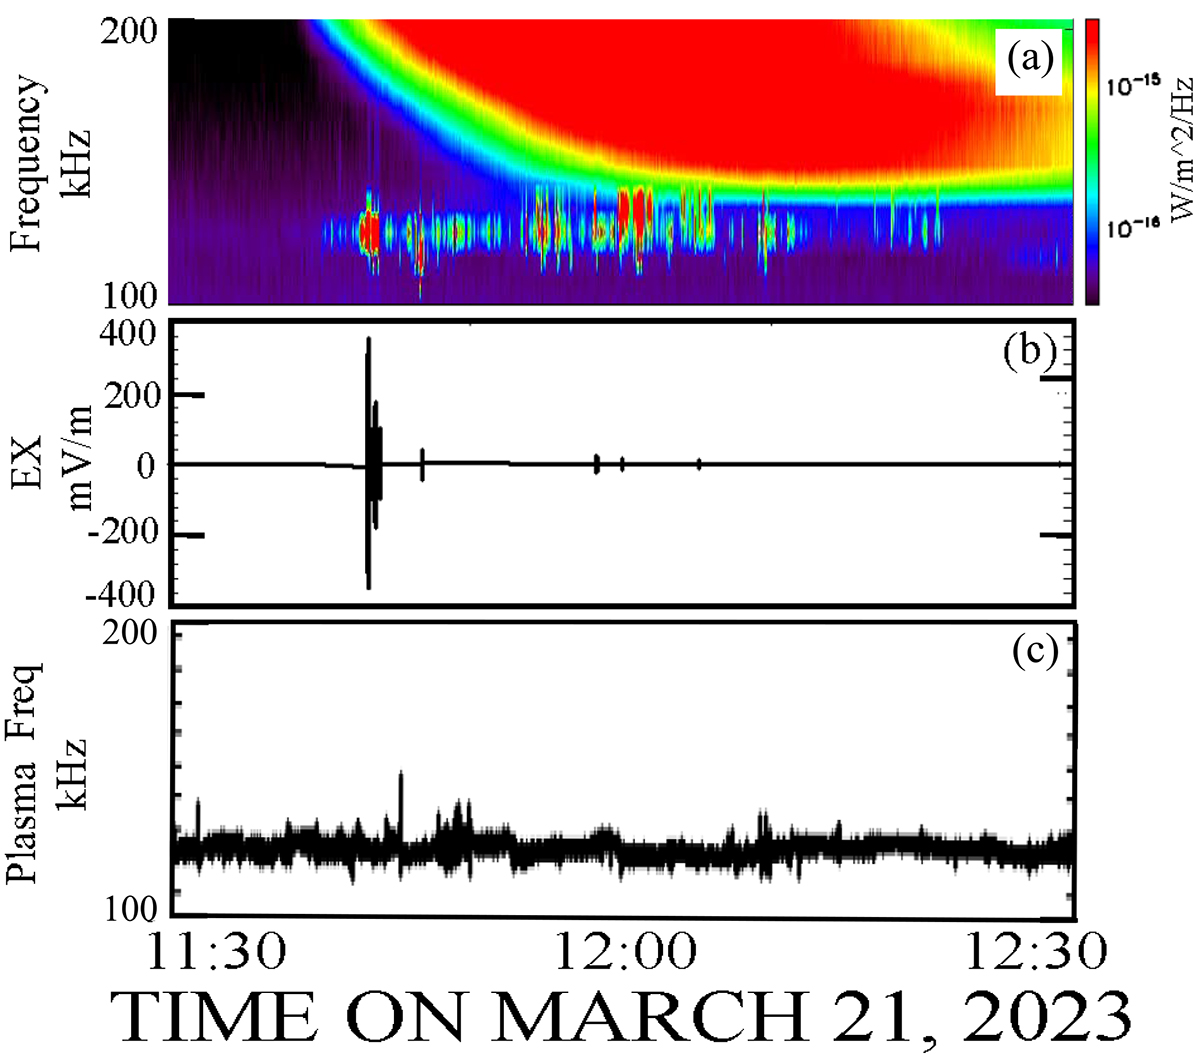
Fig. 1.
Download original image
Overview of the type III emission observed on March 21, 2023 (panel a) in which the spacecraft was embedded, showing bright lines below the emission due to large electric fields. The plasma frequency of 125 kHz in panel c shows that these bright lines were due to waves at or near the plasma frequency. These waves are present only part of the time. Panel b shows the times and electric field amplitudes of 26 data bursts taken for durations of about 15 milliseconds each at data rates in excess of one million samples/second.
Current usage metrics show cumulative count of Article Views (full-text article views including HTML views, PDF and ePub downloads, according to the available data) and Abstracts Views on Vision4Press platform.
Data correspond to usage on the plateform after 2015. The current usage metrics is available 48-96 hours after online publication and is updated daily on week days.
Initial download of the metrics may take a while.