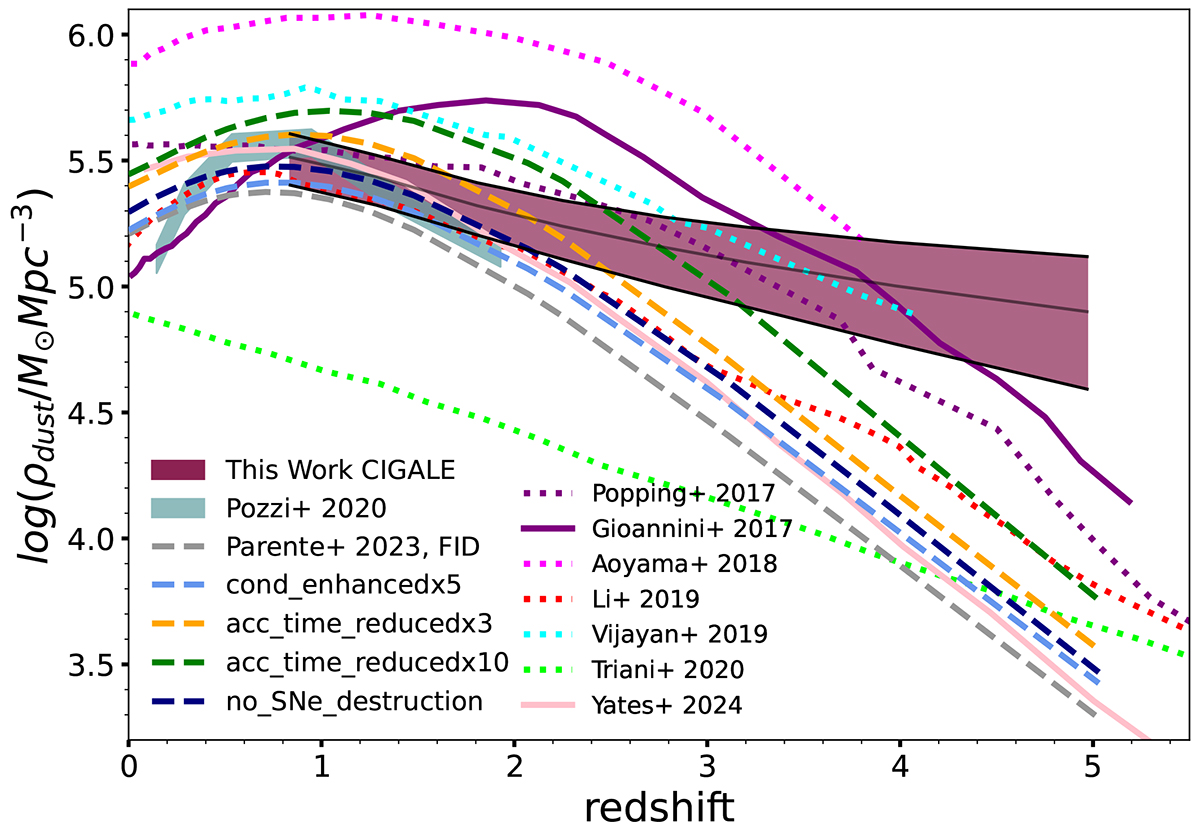
Fig. 8.
Download original image
Comparison between our DMD (derived using the CIGALE dust masses) and the predictions from simulations. The solid purple line shows the DMD by Gioannini et al. (2017), and the dashed purple line represents the prediction by Popping et al. (2017). The dotted magenta line shows the prediction by Aoyama et al. (2018), the dotted cyan line shows the DMD predicted by Vijayan et al. (2019), the dotted light green curve shows the results by Triani et al. (2020), the dotted red line shows the prediction by Li et al. (2019), and the solid pink line shows the DMD from Yates et al. (2024). The dashed gray, light blue, yellow, green, and blue lines are the DMDs estimated using the models by Parente et al. (2023) with different prescriptions.
Current usage metrics show cumulative count of Article Views (full-text article views including HTML views, PDF and ePub downloads, according to the available data) and Abstracts Views on Vision4Press platform.
Data correspond to usage on the plateform after 2015. The current usage metrics is available 48-96 hours after online publication and is updated daily on week days.
Initial download of the metrics may take a while.