Fig. 7.
Download original image
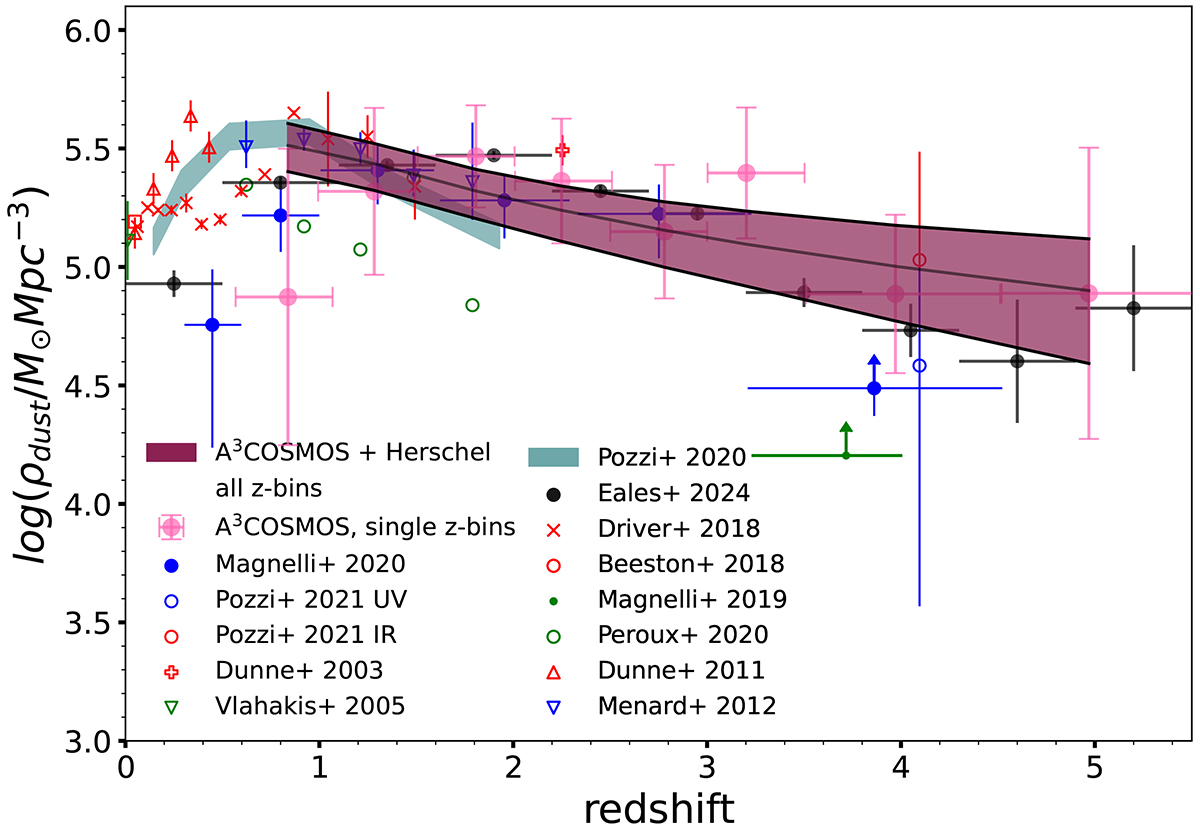
DMD evolution with redshift, derived by integrating the CIGALE + Herschel dust mass function in each redshift bin (shaded red area). The pink circles with errors represent the DMD obtained by fitting the DMF individually at each redshift bin. The red plus marker shows the values by Dunne et al. (2003), the green triangles show the estimates by Vlahakis et al. (2005), the red triangles show the DMD points by Dunne et al. (2011), the blue triangles indicate the estimate by Ménard & Fukugita (2012), the red crosses show the data points by Driver et al. (2018); the red circles show the data by Beeston et al. (2018), the estimate by Magnelli et al. (2019) is shown as a filled green circle, the empty green circles are the points by Péroux & Howk (2020), the estimates by Pozzi et al. (2021) are shown as blue and red circles; the DMDs from Magnelli et al. (2020) are displayed as filled blue circles; the black points show the DMD estimates by Eales & Ward (2024), and finally, the light blue shaded area represents the estimate of the DMD by Pozzi et al. (2020). For a self-consistent comparison, we rescaled the data by Magnelli et al. (2020) and Pozzi et al. (2021) to TD = 35K.
Current usage metrics show cumulative count of Article Views (full-text article views including HTML views, PDF and ePub downloads, according to the available data) and Abstracts Views on Vision4Press platform.
Data correspond to usage on the plateform after 2015. The current usage metrics is available 48-96 hours after online publication and is updated daily on week days.
Initial download of the metrics may take a while.