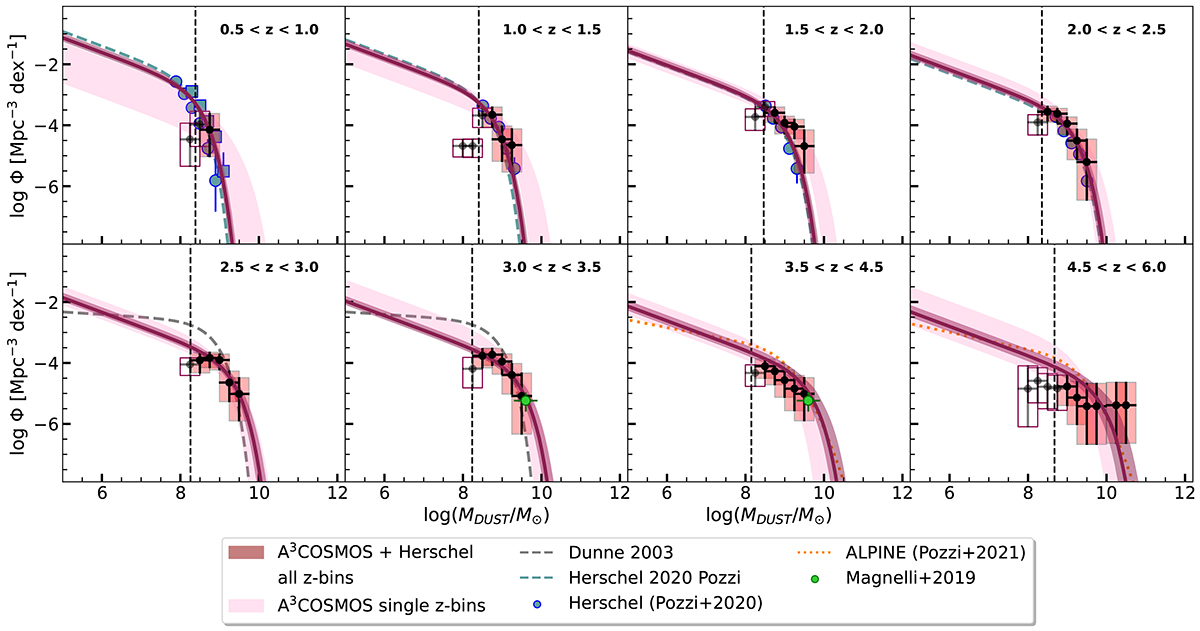
Fig. 5.
Download original image
Dust mass functions derived using the VMAX method for dust masses of the galaxies obtained via SED fitting (red boxes and black circles with errors, computed following Gehrels 1986). The evolutive best fit of the CIGALE + Herschel is displayed as a solid red line, with shaded error bands of the same color, and the individual A3COSMOS fit is shown as the shaded pink area. The errors on the evolutive best fit are computed by bootstrapping on the dust masses of the sources. For comparison, different estimates from the literature are reported. The light blue circles and squares show the values obtained by Pozzi et al. (2020), and the dashed cyan lines correspond to the best-fit. The dashed gray curves are from Dunne et al. (2003). The blue circle shows the estimate by Magnelli et al. (2019), and the dashed line is the ALPINE dust mass function by Pozzi et al. (2021).
Current usage metrics show cumulative count of Article Views (full-text article views including HTML views, PDF and ePub downloads, according to the available data) and Abstracts Views on Vision4Press platform.
Data correspond to usage on the plateform after 2015. The current usage metrics is available 48-96 hours after online publication and is updated daily on week days.
Initial download of the metrics may take a while.