Open Access
Fig. 3.
Download original image
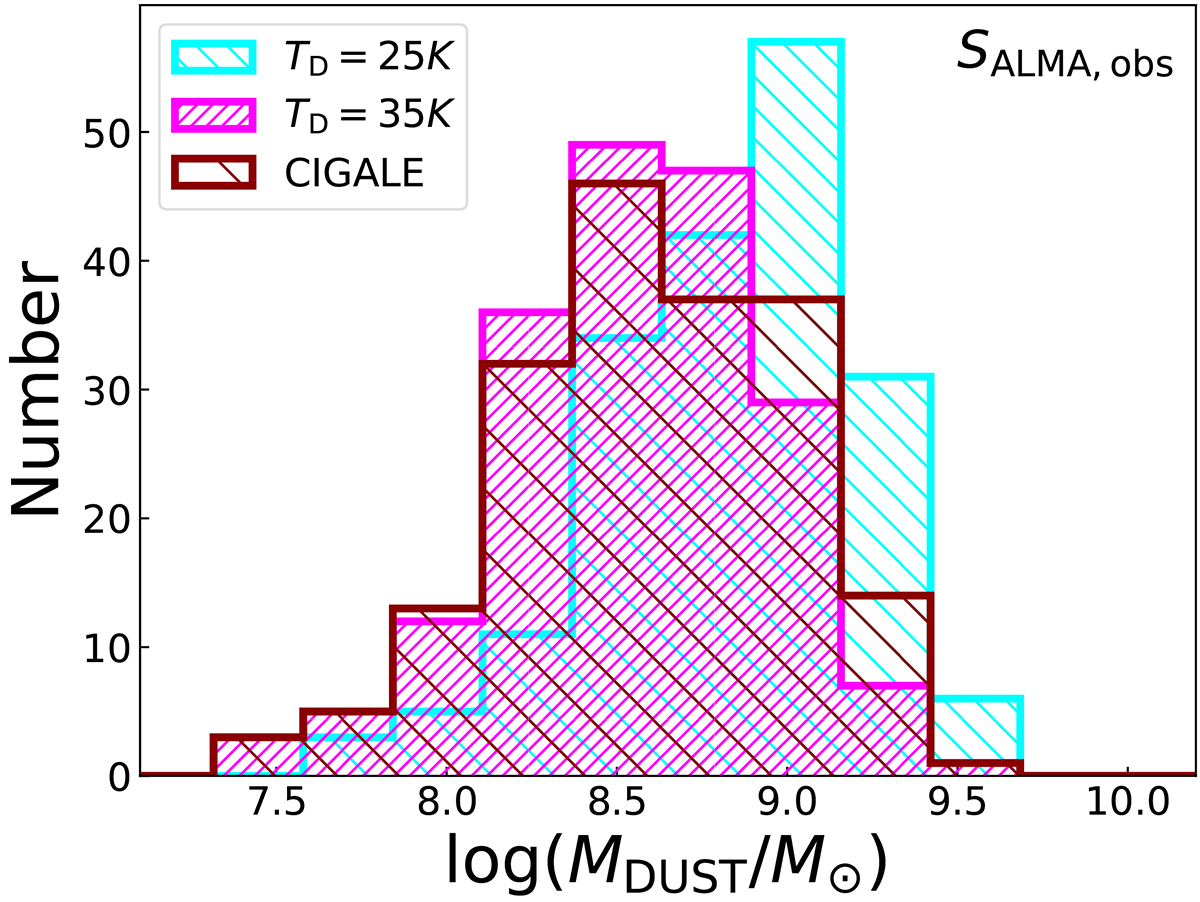
Dust mass distribution as inferred using our three different approaches, i.e., the longest observed ALMA fluxes and assuming a single MBB with a dust temperature of 25K (cyan histogram) and 35K (magenta histogram). The dark red distribution corresponds to the dust masses given as an output of the CIGALE SED fitting.
Current usage metrics show cumulative count of Article Views (full-text article views including HTML views, PDF and ePub downloads, according to the available data) and Abstracts Views on Vision4Press platform.
Data correspond to usage on the plateform after 2015. The current usage metrics is available 48-96 hours after online publication and is updated daily on week days.
Initial download of the metrics may take a while.