Fig. 5.
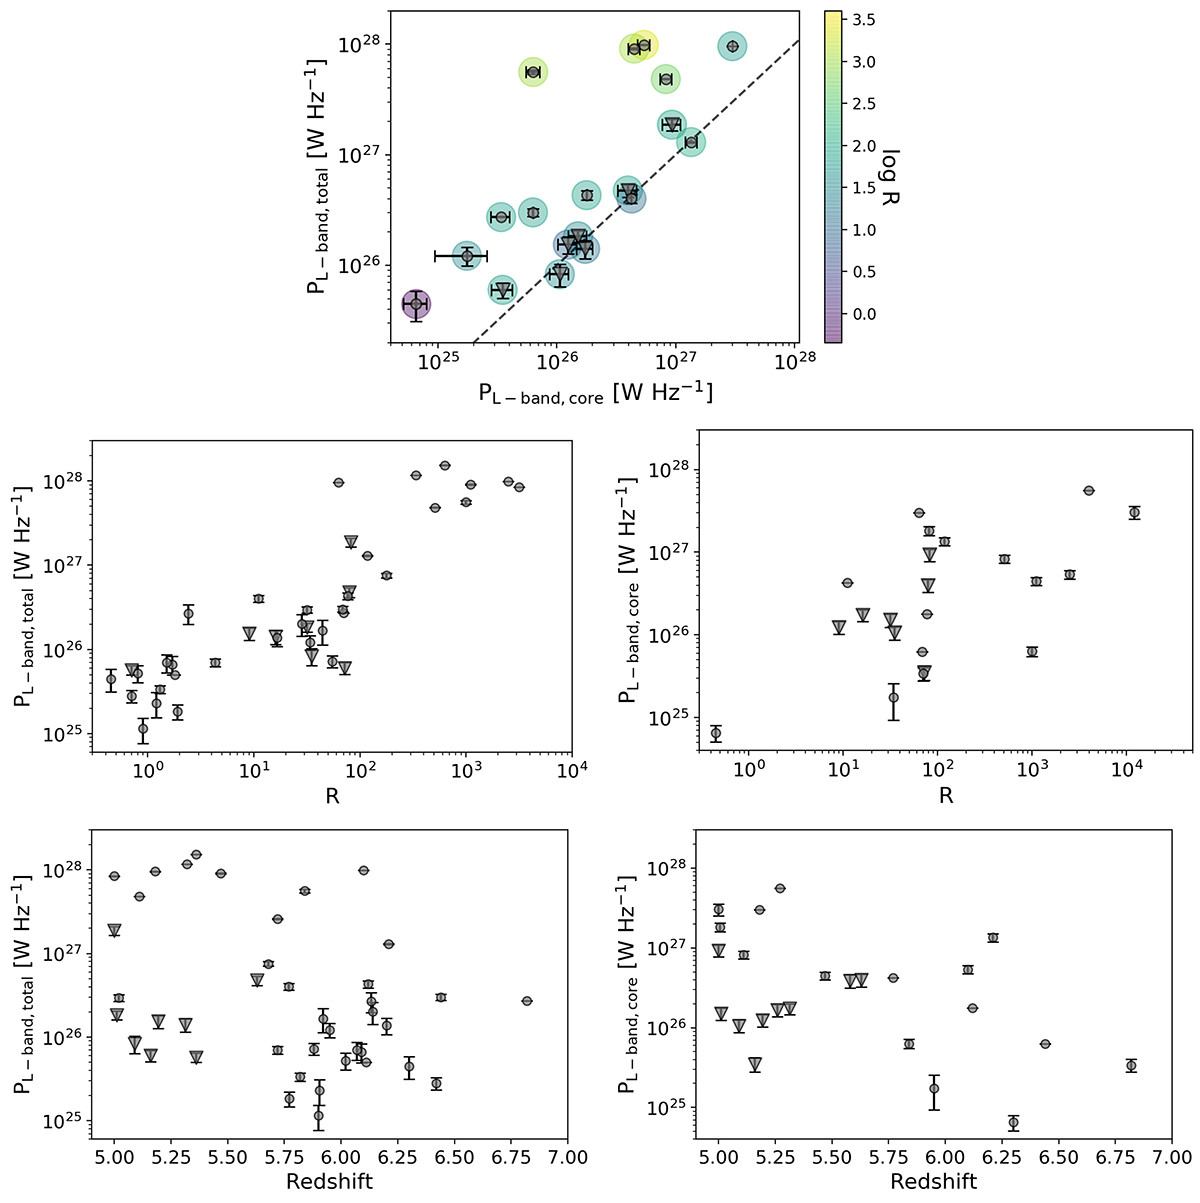
Download original image
L-band total and core monochromatic radio powers of high redshift radio sources. The sources presented in this paper are marked with triangles. Top: The comparison of L-band core monochromatic radio power and the L-band total monochromatic radio power for z > 5 sources where both values are available. The dashed line represents the Ptotal = Pcore. The colours indicate the source radio loudness. Middle: The total (left) and core (right) monochromatic radio powers of z > 5 sources as a function of radio loudness. Bottom: The total (left) and core (right) monochromatic radio powers as a function of redshift.
Current usage metrics show cumulative count of Article Views (full-text article views including HTML views, PDF and ePub downloads, according to the available data) and Abstracts Views on Vision4Press platform.
Data correspond to usage on the plateform after 2015. The current usage metrics is available 48-96 hours after online publication and is updated daily on week days.
Initial download of the metrics may take a while.