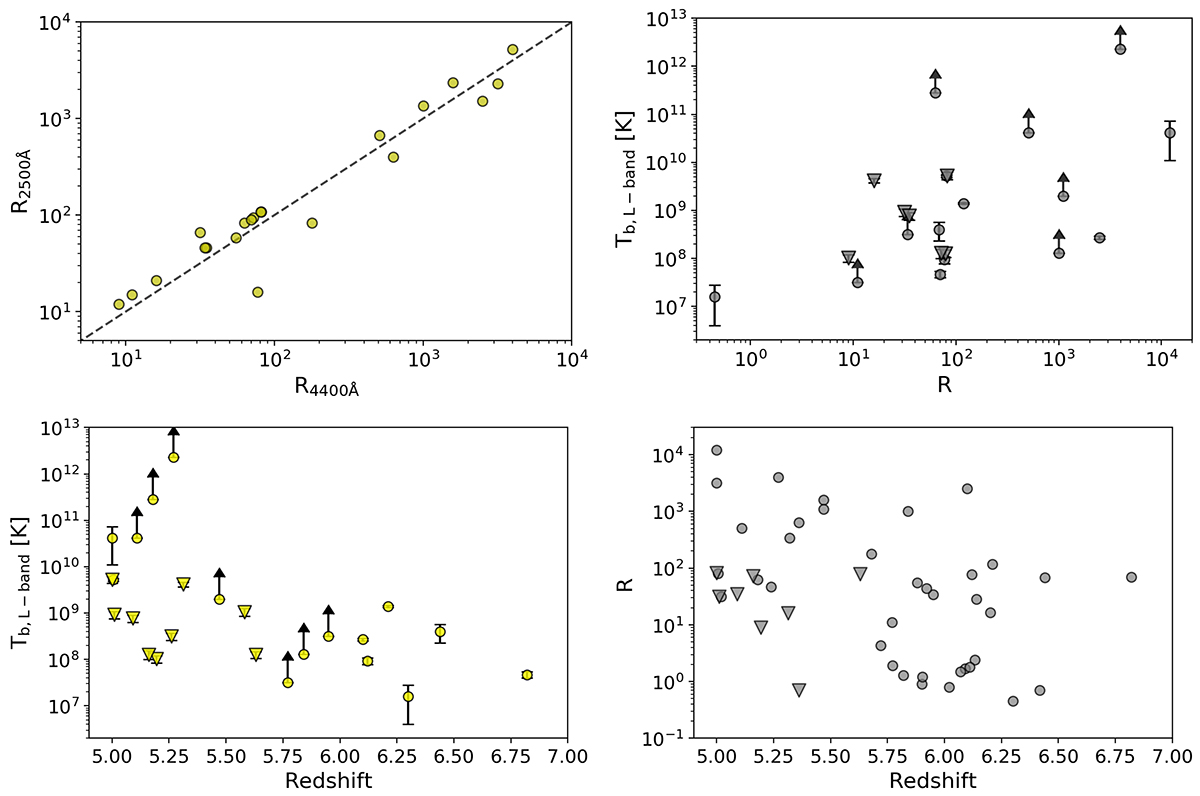
Fig. 4.
Download original image
Radio-loudness and brightness temperature relation of high redshift radio sources. Top left: The R2500 Å index as a function of R4400 Å for sources where both values are available in the literature. The dashed line represents R2500 Å = R4400 Å. Top right: The redshift-corrected L-band brightness temperatures as a function of radio loudness. The sources presented in this paper are marked with triangles. Bottom left: The redshift-corrected L-band brightness temperature measurements for all z > 5 AGN published to date, including those presented in this paper (triangles), as a function of redshift. Bottom right: The ![]() and R2500 Å = L5 GHz/L2500 Å (where R4400 Å is not available) radio-loudness indices of z > 5 sources as a function of redshift.
and R2500 Å = L5 GHz/L2500 Å (where R4400 Å is not available) radio-loudness indices of z > 5 sources as a function of redshift.
Current usage metrics show cumulative count of Article Views (full-text article views including HTML views, PDF and ePub downloads, according to the available data) and Abstracts Views on Vision4Press platform.
Data correspond to usage on the plateform after 2015. The current usage metrics is available 48-96 hours after online publication and is updated daily on week days.
Initial download of the metrics may take a while.