Fig. 3.
Download original image
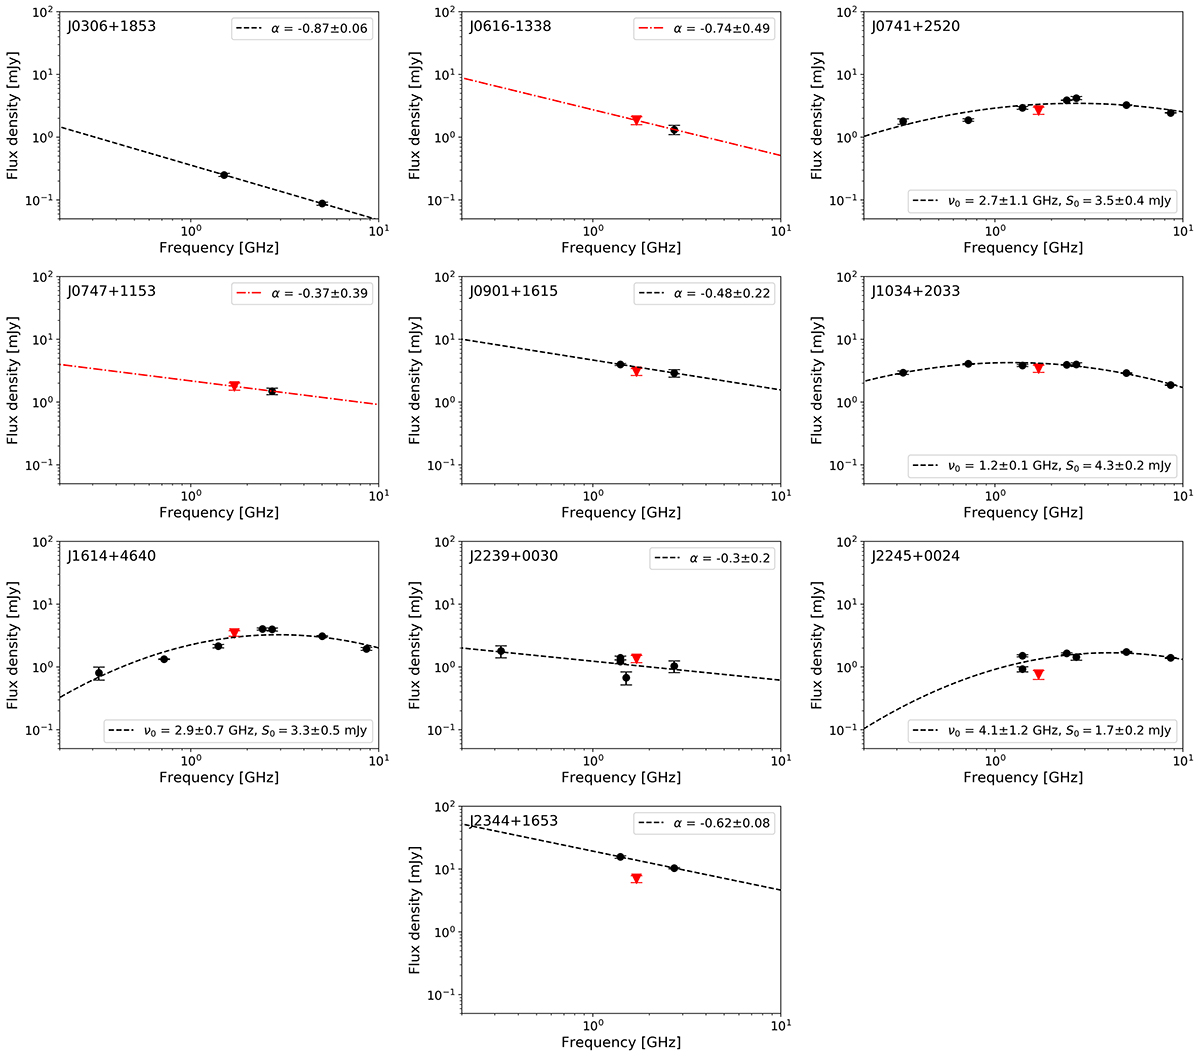
Radio continuum spectra of the ten sources in our sample. Black points indicate total flux density data from single-dish and low-resolution interferometric measurements. The black dashed lines show the best-fit spectrum (power-law or log-parabolic). The parameters of the spectral fits are given in the insets and listed in Table 4. The red data points are the 1.7-GHz EVN flux density measurements presented in this paper. The red dashed-dotted lines for J0616−1338 and J0747+1153 show the power-law function fitted to the only available two flux density data points (VLASS and EVN), with the assumption that all the radio emission is confined to a small spatial scale corresponding to the compact VLBI component.
Current usage metrics show cumulative count of Article Views (full-text article views including HTML views, PDF and ePub downloads, according to the available data) and Abstracts Views on Vision4Press platform.
Data correspond to usage on the plateform after 2015. The current usage metrics is available 48-96 hours after online publication and is updated daily on week days.
Initial download of the metrics may take a while.