Fig. 5
Download original image
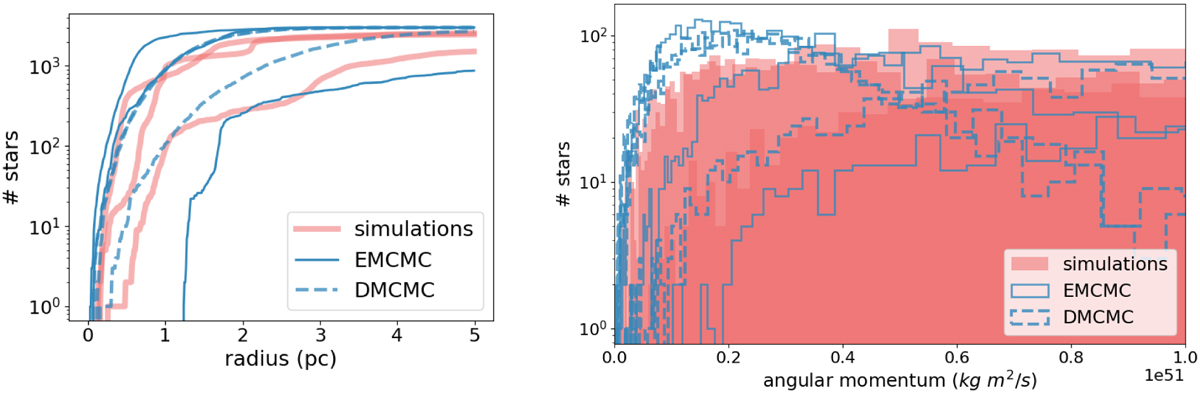
The distributions of key physical paramters for the new sampled clusters. The left subfigure shows the number of stars as a function of the distance to the cluster’s centre of mass for a set of simulated clusters, DMCMC and EMCMC (three clusters each). On the right subfigure is plotted a histogram of the angular momentum distribution of the stars for the same sets of clusters as in the left subfigure. The angular momentum is measured in the units of the international system.
Current usage metrics show cumulative count of Article Views (full-text article views including HTML views, PDF and ePub downloads, according to the available data) and Abstracts Views on Vision4Press platform.
Data correspond to usage on the plateform after 2015. The current usage metrics is available 48-96 hours after online publication and is updated daily on week days.
Initial download of the metrics may take a while.