Fig. 2
Download original image
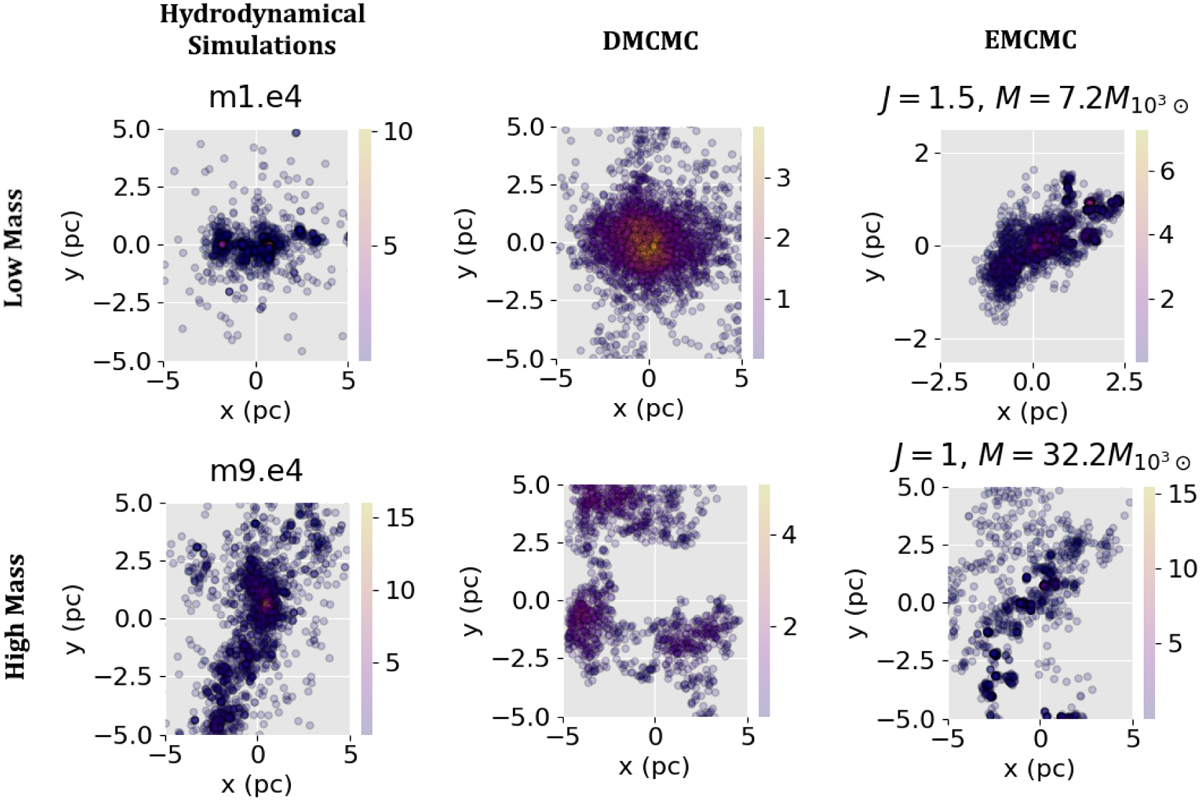
Two-dimensional representation of one low-mass and one high-mass cluster generated with DMCMC and EMCMC, respectively. For comparison, the corresponding projections are illustrated also for the hydrodynamically simulated clusters m1.e4 and m9.e4 from the work of Ballone et al. (2020). The x and y coordinates are measured in parsecs. For EMCMC, we show the value of the hyper-parameter J (maxJump) and the total mass expressed in ![]() solar masses.
solar masses.
Current usage metrics show cumulative count of Article Views (full-text article views including HTML views, PDF and ePub downloads, according to the available data) and Abstracts Views on Vision4Press platform.
Data correspond to usage on the plateform after 2015. The current usage metrics is available 48-96 hours after online publication and is updated daily on week days.
Initial download of the metrics may take a while.