Fig. B.1.
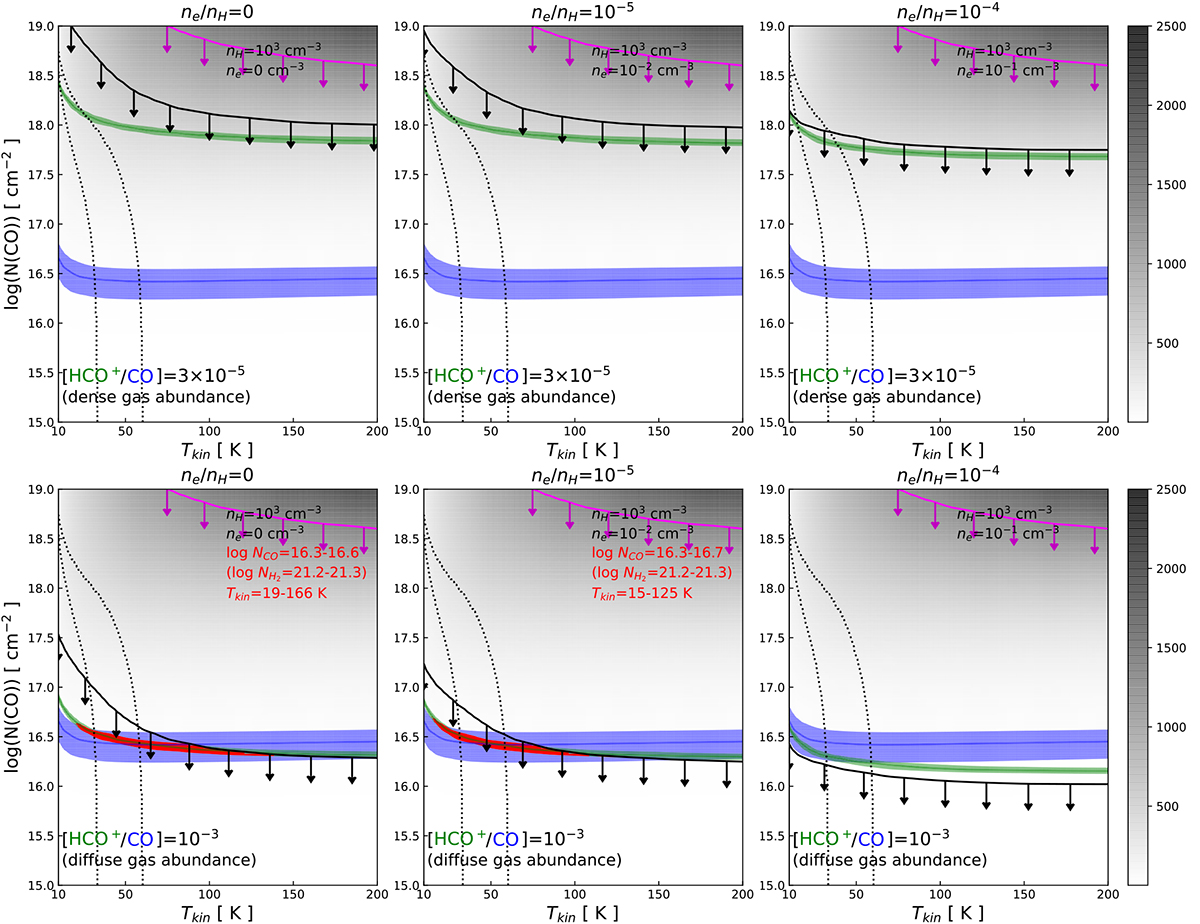
Download original image
Radiative transfer predictions from RADEX for an HCO+/CO abundance ratio typical of the dense (top) and diffuse gas (bottom). The blue and green areas show the range of observed CO(1–0) and HCO+(1–0) integrated intensities, while the black and magenta lines indicate the upper limits of HCN(1–0) and SiO(2–1). The columns correspond to predictions for relative electron abundances of ne/nH = 0 (left), ne/nH = 10−5 (middle), and ne/nH = 10−4 (right). The red areas correspond to the models that reproduce the CO and HCO+ intensities and the HCN upper limit. The dotted lines indicate the models that reproduce the mid-J CO lines emission from Salomé et al. (2019).
Current usage metrics show cumulative count of Article Views (full-text article views including HTML views, PDF and ePub downloads, according to the available data) and Abstracts Views on Vision4Press platform.
Data correspond to usage on the plateform after 2015. The current usage metrics is available 48-96 hours after online publication and is updated daily on week days.
Initial download of the metrics may take a while.