Open Access
Fig. 2.
Download original image
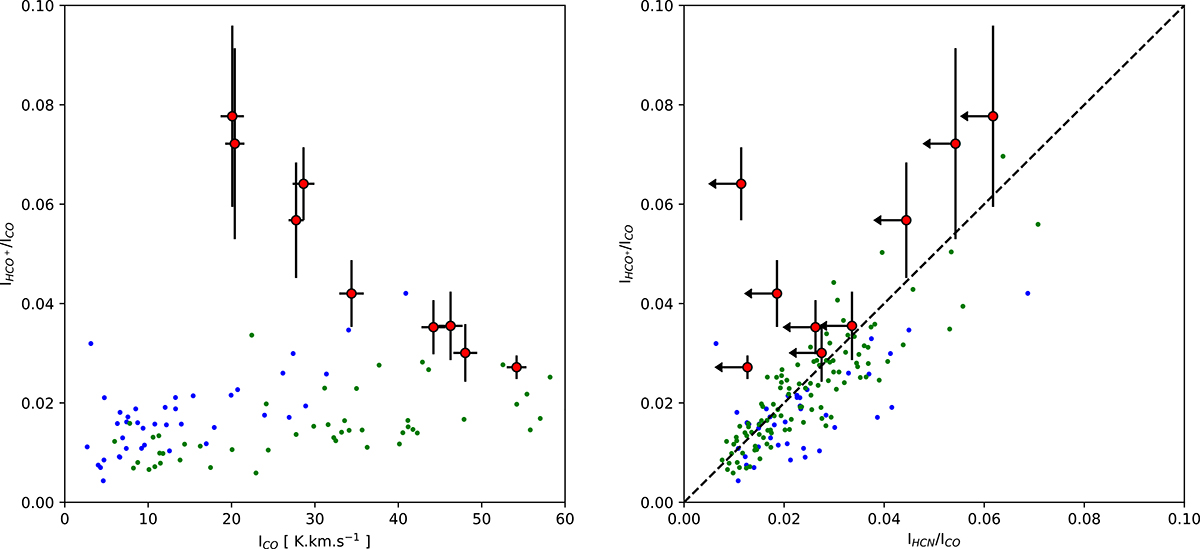
IHCO+/ICO as a function of ICO (left) and IHCN/ICO (right). The red points are the clumps in Table 2, and the blue and green points come from the EMPIRE (Jiménez-Donaire et al. 2019) and ALMOND surveys (Neumann et al. 2023). The dashed line in the right panel shows the unity relation.
Current usage metrics show cumulative count of Article Views (full-text article views including HTML views, PDF and ePub downloads, according to the available data) and Abstracts Views on Vision4Press platform.
Data correspond to usage on the plateform after 2015. The current usage metrics is available 48-96 hours after online publication and is updated daily on week days.
Initial download of the metrics may take a while.