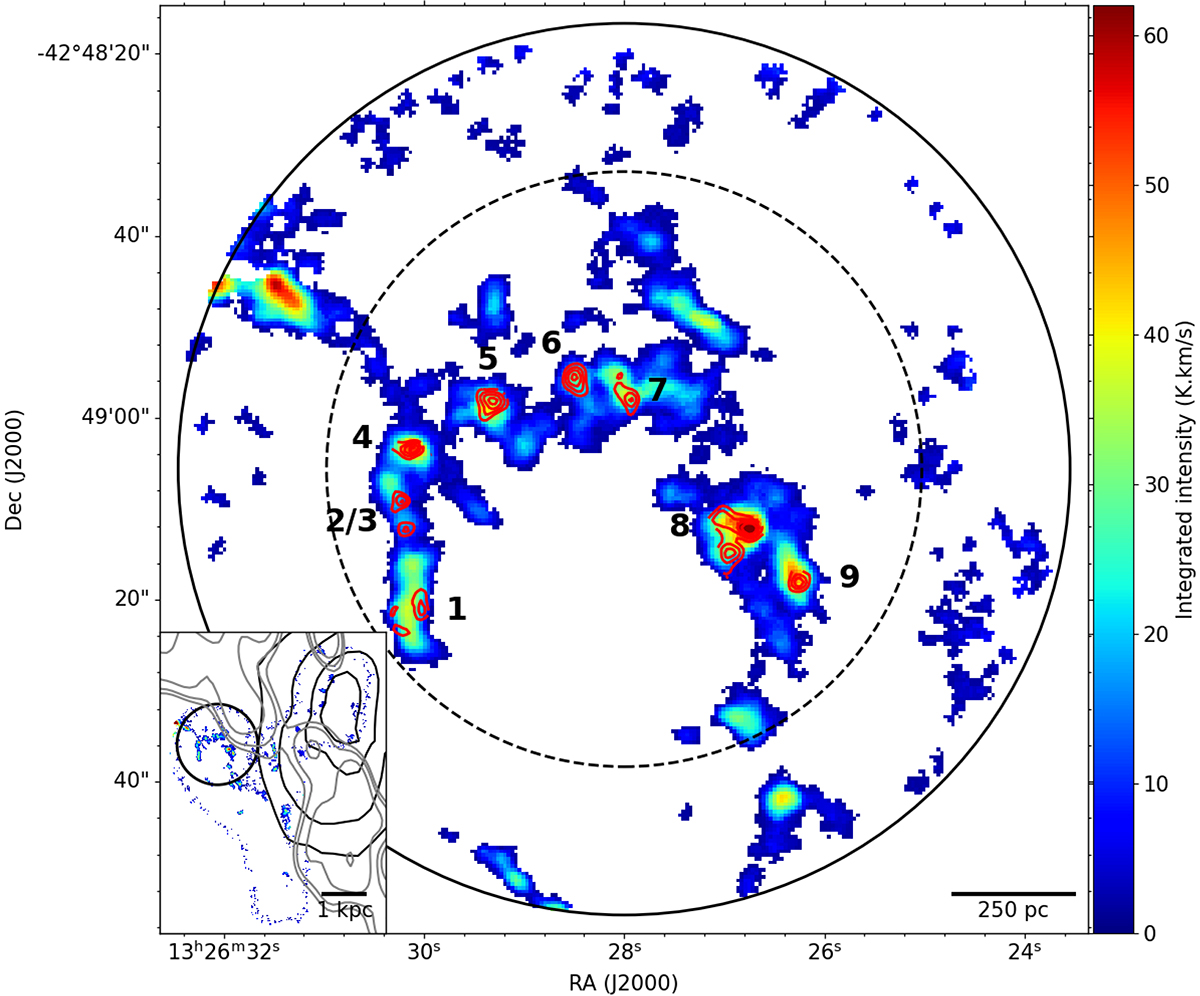
Fig. 1.
Download original image
Moment 0 map of the CO(1–0) emission at the resolution of the HCO+ observations. The red contours are those of the HCO+ emission. The solid line and dashed circles correspond to the field of view and the FWHM of the HCO+ primary beam, respectively. The numbers are the clump labels. Subpanel: Position of the HCO+ field of view with respect to the Hi@ shell (black contours) and the radio continuum (grey contours). A larger spatial overview is provided in Fig. 1 of Oosterloo & Morganti (2005), where the region is labelled ‘outer filament’.
Current usage metrics show cumulative count of Article Views (full-text article views including HTML views, PDF and ePub downloads, according to the available data) and Abstracts Views on Vision4Press platform.
Data correspond to usage on the plateform after 2015. The current usage metrics is available 48-96 hours after online publication and is updated daily on week days.
Initial download of the metrics may take a while.